A wide number of VWAP strategies have been developed by market experts in an effort to capitalise on the insight provided by knowing the amount of trading activity at certain prices. These are widely regarded as offering an at times superior, and at least complementary, approach to simple moving averages (SMAs), which only use price data. In this article, we’ll establish how VWAP is calculated for currency pairs, how it is used, and the pros and cons of including it in the analysis process for Forex Trading.
What Is the Volume-Weighted Average Price of a Currency Pair?
VWAP is a measure of a currency pair’s price over a period of time. It reflects the range of price levels at which different forex trades were executed, and also how much trading activity was conducted at those different levels. This means that the VWAP number identifies the region on the price charts where the most trades were booked.
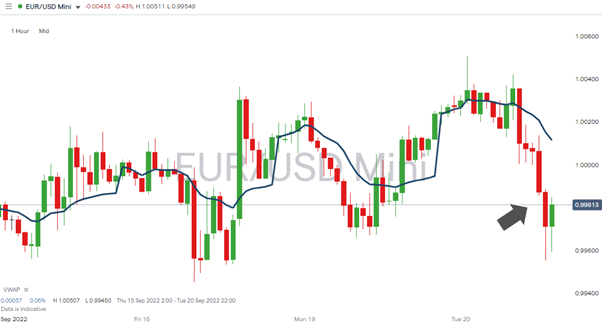
The below price chart of the EURUSD market is a candlestick chart set to one-hour time intervals. The blue line is the VWAP for the same time interval. In this instance, the largest volume of trading has been carried out in the region of 1.002, hence the VWAP being at that level – though at the time of taking the reading, the live market price was 0.99813. Those trades in the region of 0.99813 give an accurate reflection of current live market price, but represent trades that are smaller in size. VWAP in this instance indicates that most of the buying and selling took place at a higher level.
EURUSD – 15-Minute Price Chart – With VWAP

Source: IG
Forex VWAP calculations can be set to various timeframes, but as it is popular among intraday traders, the commonly used timeframes range from five minutes to four hours. The calculation of VWAP requires opening and closing prices to be available, so it is not possible to provide a calculation at the tick level. One other note regarding its construction is that while the forex markets operate around the clock on a 24/5 basis, most analysts and brokers stick with VWAP being applicable to one day’s trading session.
How to Calculate VWAP
VWAP is calculated by taking the total dollar value of every trade and dividing that number by the total amount of the forex pair that has been traded.
VWAP = (Cumulative Typical Price x Trade Volume) / Cumulative total of the currency pair traded during the session.
Cumulative Typical Price (CTP) for any time interval = (High Price + Low Price + Closing Price) / 3
Standard VWAP is denoted as a single number – the VWAP of that day’s trading session. It will fluctuate during the course of the session, and as per our EURUSD example, can also be expressed as a line on a price chart. The VWAP line is created by breaking the whole day into smaller timeframes – in this instance one hour, and logging each individual reading so that a line can be drawn. Online platforms have algorithms that perform these functions for traders, which makes VWAP an even more user-friendly tool.
How to Use VWAP
The nature of VWAP makes it a tool that is useful to short-term speculators and day traders, who can use it to identify intraday pricing anomalies. It is also used by larger institutions that want to build sizeable currency positions as patiently as possible to stop their own trading activity driving market price away from them.
VWAP offers an instant guide as to whether a currency pair can be considered to be over or undervalued in a particular timeframe. When the current market price is above VWAP, then it is considered overvalued, and vice versa.
Interpreting that data and turning it into a trading decision is harder to do. The Fear and Greed Index, for example, explains how markets can overshoot to the upside and downside whenever enthusiasm or panic takes hold. In a scenario where market price is above VWAP, this could signal that short-term buying pressure is overdone and that price will in the near future weaken and revert to the average. Alternatively, it could be a sign that momentum is building, maybe due to a news report being released, and a breakout of the existing trading range could be imminent.
As a result, VWAP is often used in conjunction with other technical indicators. The more indicators that are aligned, the stronger the overall signal to buy or sell a particular currency pair.
So far, we’ve outlined ways that VWAP can be used by day traders, but not all investors who use VWAP are looking for a quick return such as those offered by a scalping strategy. A large investor such as a pension fund or systematic hedge fund might also use VWAP if they are looking to build a significant position in a currency as part of a long-term strategy. If market conditions allow, they will wait for moments during the day when price is the right side of the VWAP line, which avoids their own trading activity causing price to break out of the price range at which they want to buy it.
Pros and Cons of Using VWAP to Trade Stocks
VWAP is a straightforward and intuitive measure of market conditions. It takes the simplicity of moving averages and adds another metric: trade volumes. By doing so, it provides a more informative insight into market conditions without bringing in unnecessary additional complexity.
Any trading indicator that is both easy to understand and useful soon becomes popular within the trading community, and VWAP is one of those self-fulfilling indicators that to some extent work because so many people use them. Forex investors, from retail day traders to billion-dollar funds, follow VWAP and use it to optimise their trade entry points.
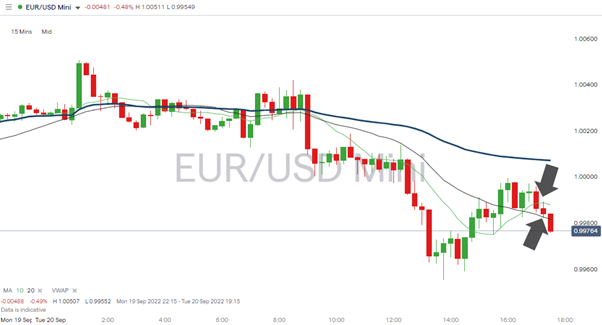
Another advantage that VWAP has over SMAs is that it tends to be less volatile. The below chart includes an overlay of the 10 and 20 SMAs on the 15-minute price chart. While price criss-crosses the SMAs, the VWAP by comparison is an indicator that filters out some of the market ‘noise’.
EURUSD – 15-Minute Price Chart – With VWAP and SMAs

Source: IG
One of the main drawbacks of VWAP is that it is a lagging indicator. The data that goes into creating it is all historical, and while it offers an accurate report on where price and trade volumes have been, this doesn’t necessarily translate into being able to predict future price moves.
VWAP is also less sensitive to recent periods (and price moves). This is due to the large volume of accumulated data that goes into the construction of the calculation and includes activity from the very start of the trading day. All of the time intervals are given equal weighting. This means that if using five-minute candles in the afternoon of a trading day, then trading activity from six hours previous could be included in the VWAP number. It is easy to argue that this reduces the usefulness of the metric.
Something else that traders need to check when using VWAP is the source of the trade volume data. Brokers might use data from their own accounts rather than from the entire market, and this would be an inferior data source. Some of the different VWAP indicators available on the popular MetaTrader platform differentiate themselves from their competition by outlining how they use the ‘best’ data source for their particular model.
Final Thoughts
If you are looking to use VWAP to engage in short-term forex trading, then some thought needs to be given to broker selection. High-frequency currency traders place a high priority on their broker being able to execute trades reliably and at high speed. These reviews offer a breakdown of the pros and cons of respective brokers.
While the currency markets themselves are unregulated, regulated forex brokers that operate in the sector have gone to the trouble of attaining licences from financial institutions such as the FCA, SEC, CySEC and ASIC. This not only results in clients benefiting from more protection, but is also a sign that the firms are serious operations. This makes it more likely that they will also have the research and analysis tools needed to tip the odds in your favour. This can be beneficial because while VWAP is a useful metric, there is always some benefit to be gained from incorporating other indicators to check if a trading signal is confirmed, or not.


