We at AskTraders decided to conduct some in-depth analysis to find the best and worst high streets in the UK as retail closures reach a five-year high with around 16 stores being forced to close each day.
We looked at open data from Link ATM, Which? and the Office for National Statistics (ONS) which analysed ATM, retail store and bank closures in fifty of the largest cities and towns in the UK. We then looked at the percentage of opens and retail growth in comparison, to discover the best and worst high streets in the UK.
The state of retail: Crisis as high street retail closures reach record levels
During the first half of 2019 around 16 stores closed their doors every day, whilst only nine stores were opened. This has resulted in a net decline of 1,234 chain stores across Britain’s high streets, according to data collected by PricewaterhouseCoopers (PwC) and the Local Data Company (LDC).
The decline this year was greater than the 1,123 closures during the same period last year, following a mere 222 in 2017. This is the highest number of closures recorded over the last five years.
Business restructurings, a change in shopping habits, industry competition and Brexit uncertainty amongst some of the most popular reasons for stores closing.
Multiple chains were hardest hit, as Poundworld, Maplin and Toys R Us all went into administration last year. Travel giants Thomas Cook and fashion retailer BonMarche were some of the most recent companies to go bust – resulting in the loss of thousands of jobs.
Cash strapped: over 300 ATMs and 55 bank branches closed each month in 2019!
According to Link.co.uk, the number of free-to-use ATMs has decreased from
54,500 to 47,700 between January 2018 and August 2019.
A total of 6,800 ATMs have closed during this time, resulting in a 12% reduction of the number of ATMs available on the UK’s high streets. That’s over 300 closures per month.
Whereas a total of 3,312 banks and building societies were closed in the UK between January 2015 and August 2019 – according to data released by which.co.uk.
Over 1,100 of those closures have taken place since January 2018 – that’s an average of 55 closing each month. A further 100 branches are set to close before the end of this year.
The Royal Bank of Scotland (RBS), Barclays and Natwest were amongst the worst hit. Over the last year and a half, RBS have closed a whopping 277 branches, and are the firm with the most closures.
Coming in second is Barclays who have closed 243 branches, closely followed by Natwest who have closed 197 of their branches.
Poole, a coastal town in Dorset, revealed as the most declining high street in the UK
We analysed the rate of ATM, bank and retail store opens and closures across the high streets of fifty towns and cities in order to find the best and worst high streets in the UK.
We ranked each location by their performance across three measures – ATM, bank and retail store decline. Each metric had a best-performing location (which received a score of 1) and a worst-performing location (which received a score of 50). Across the three measures (ATM, Bank, Retail) the average score is taken, making the lowest score the best performing city.
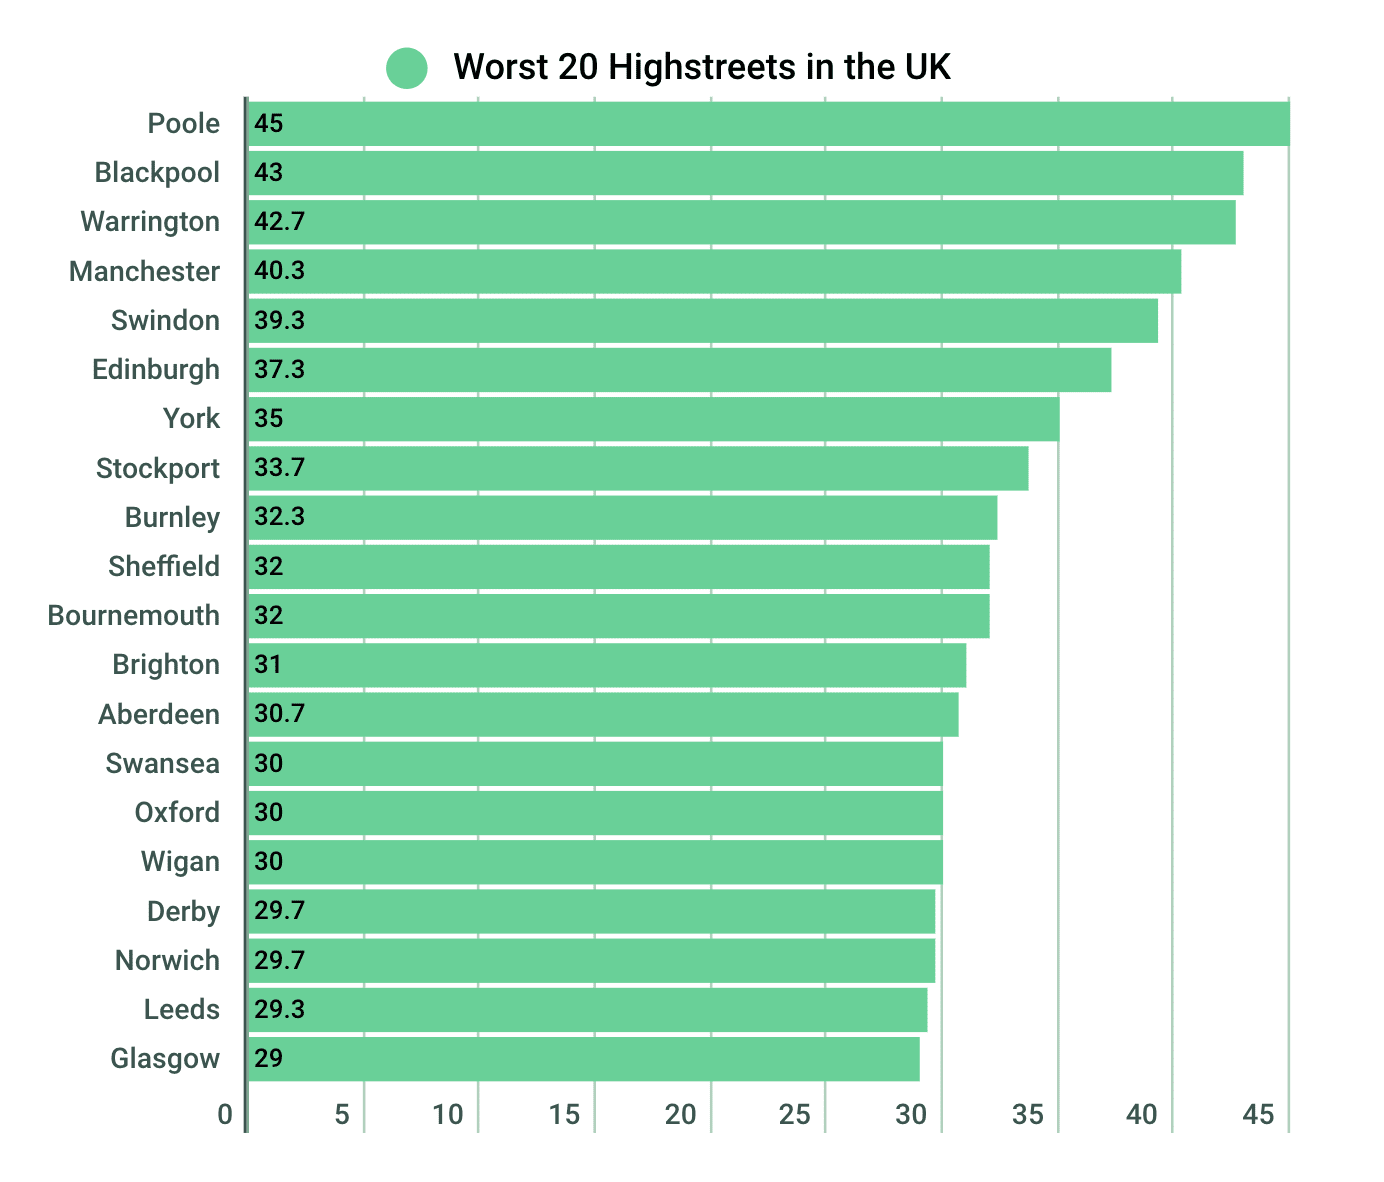
Of the 50 high streets, we analysed the below were the bottom 20 high streets in the UKrage R
Our data reveals that Poole is the home to the most declining high street in the UK, receiving the highest average rating of 45.0.
Between June and August 2019, LINK ATM growth was down by -5.36% and since 2015 around 42% of bank branches in the town have closed. In terms of retail growth, there was a -4% decrease in the number of retail enterprises in the area.
Coming in second is Blackpool, which received an average rating of 43.0. LINK ATM growth was down by -2.92%, 46% of banks in the area had closed and there was a -2% decrease in retail growth.
Following closely is Warrington, who received an average rating of 42.7. Again, LINK ATM growth had seen a decline by -3.32%, around 41% of local bank branches had closed their doors and there was a -4% decrease in retail store opens.
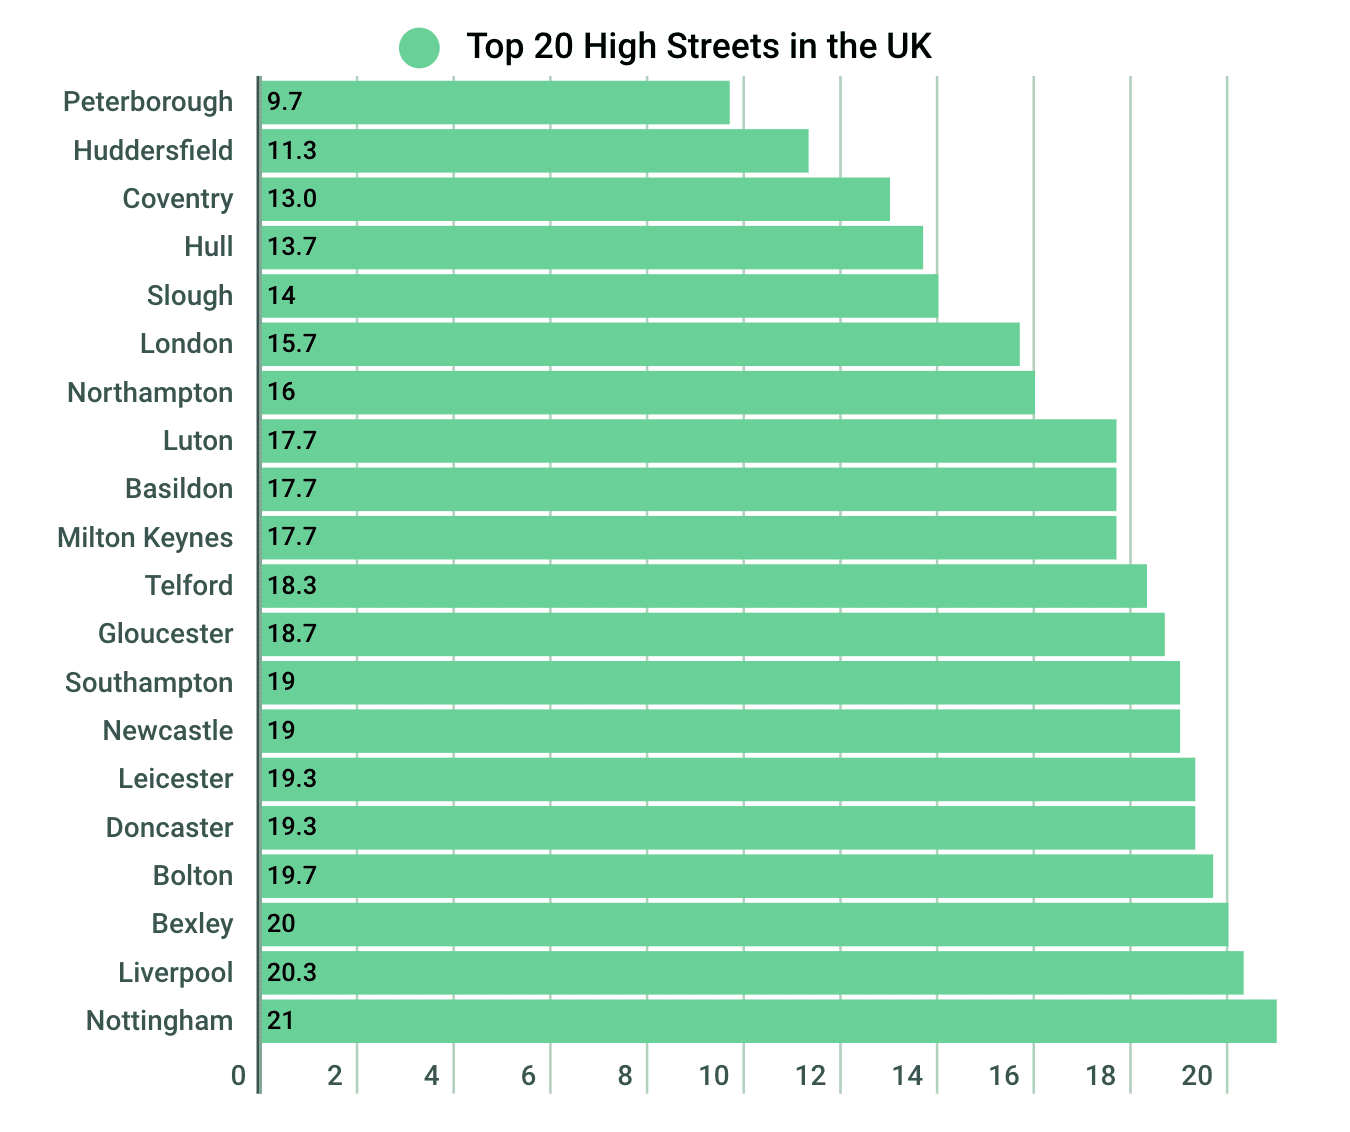
Of the 50 high streets, we analysed the below were the top 20 high streets in the UK

When analysing the data Peterborough comes up top with the UK’s best high street, receiving the lowest average rating of 9.7.
Between June and August 2019, LINK ATM growth was up by 0.62% and since 2015 only 11% of bank branches in the town have closed down. In terms of retail enterprise growth, there was a 1% increase in the number of retail store opens in the area.
The town of Huddersfield wins second place, with an average rating of 11.3. LINK ATM growth had seen no change whatsoever, 25% of banks in the area had closed and there was a whopping 9% increase in retail growth.
In third place is Coventry, who received an average rating of 13.0. LINK ATM growth had seen a very slight decline by -0.25%, around 22% of local bank branches had closed their doors and there was a 5% increase in retail store opens.
Why is the UK high street in the state that it is?
Comment from Steve Miley, Senior Market Analyst at AskTraders, said:
“The UK high street has been weathering tough trading conditions with many UK retailers dropping by the wayside. Traditional retail store closures are on the up as businesses grapple with a weak consumer in the face of Brexit uncertainty, the unabated rise of e-commerce, higher costs and changing tastes.”
He continues: “There are, inevitably, going to be winners and losers. High street retailers with inflexible business models that have failed to adapt to their changing environment are and will be the most noticeable casualties. Big names have just vanished from our high street and there will certainly be more to come.
The challenges that the High street is facing aren’t going anywhere fast. This will be a case of survival of the fittest. Those retailers that can evolve whilst still giving their customers exactly what they want could have a lot to gain.”
SOURCES AND METHODOLOGY
Methodology:
Sum of ATMs opened (total ATMs in Aug 2019, minus total ATMs in June 2019) – This shows the increase or decrease in ATMs between June and August 2019. Where there is a minus figure ATMs, to that amount, were closed. 4 would show four ATMs have been opened in that area during that time.
Sum of Branches lost since 2015 – How many branches were closed since 2015, calculated using the “Branches left” and the “% of network lost since Jan 2015”
Sum Retail stores opened/closed (between 2017 and 2019) – The sum of retail stores opened or closed in that area. Although beware some cities may have had 10 open and 10 close, giving a sum of 0. This is the correct way to report it as they could have been direct replacements, we're not to know.
LINK ATM- % growth June-August 2019 – % increase in ATMs during that period
Branches – % of network lost since Jan 2015 – % of branches lost from 2015 to 2019
Retail % growth 2017-2019 – % growth increase or decrease in total retail enterprises, in a given area
Average rank – above 4,5,6 are individually ranked to give the best of each a score of 1 and the worst-performing a score of 50. Across the three measures the average score is taken, making the lowest score the best performing city (as it's on average the closest to being number one)
Sources:
Retail – ONS 2019 report, table 6 – https://www.ons.gov.uk/businessindustryandtrade/business/activitysizeandlocation/datasets/ukbusinessactivitysizeandlocation
Cash Machines – Monthly ATM Footprint – Report-https://www.link.co.uk/initiatives/financial-inclusion-monthly-report/
Brank branches – Which? bank branch closure checker – https://www.which.co.uk/money/banking/switching-your-bank/bank-branch-closures-is-your-local-bank-closing-a28n44c8z0h5


