Key points:
- The Direxion Semiconductor (SOXL) stock has fallen 83% this year.
- The ETF’s poor returns amplify those of the underlying ICE index.
- SOXL Investors should know the risks associated with leveraged ETFs.
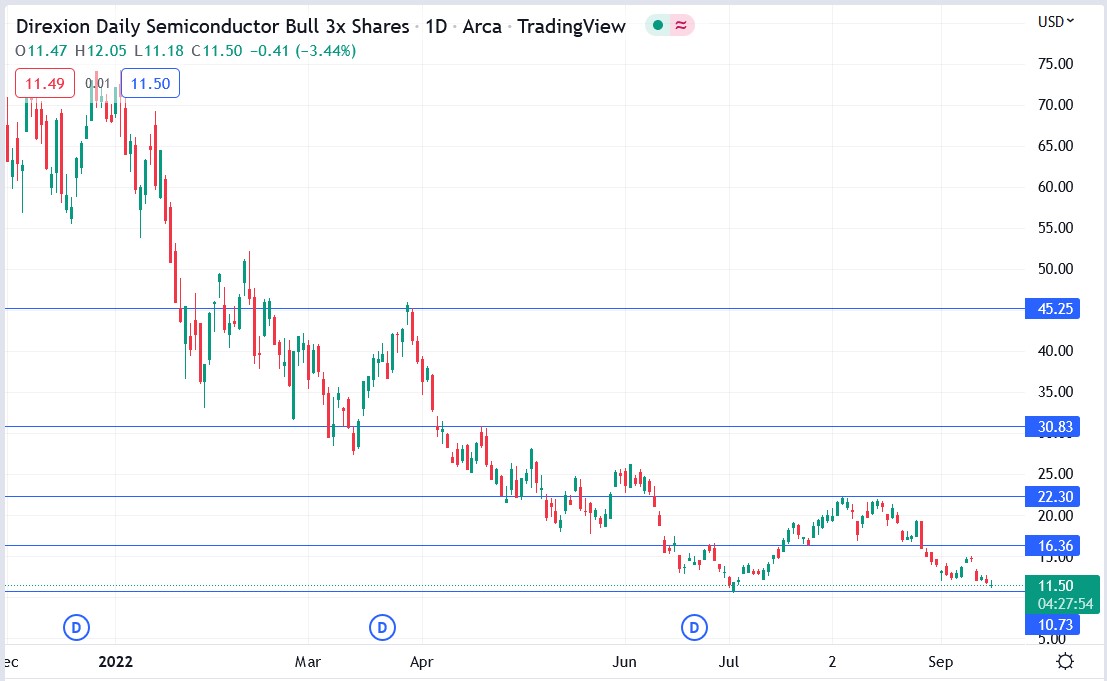
The Direxion Daily Semiconductor Bull 3X Shares (NYSEARCA: SOXL) have fallen 83% this year and could be on the verge of a significant breakout. The SOXL price chart below shows that the leveraged ETF has formed a head and shoulders pattern.
The head and shoulders pattern is usually a bearish pattern that tends to lead to further losses, and the chart shows that the latest leg of the current downtrend in the SOXL price came off a head and shoulders pattern.
Also read: What Are Exchange Traded Funds (ETFs)?
However, there is another pattern on the chart since SOXL shares have fallen to a significant support level, which could be the basis for a rally higher. However, investors who buy the ETF should monitor their positions closely since a break of the support level would lead to the continuation of the current downtrend.
Investors should remember that SOXL is a leveraged ETF that tracks the performance of the
ICE Semiconductor Index (ICESEMI), since it is impossible to trade an index directly. SOXL in a 3X inverse ETF that seeks to return 300% of the movements in the underlying index.
The index has fallen heavily this year, and so has SOXL. Nevertheless, as a bullish 3X ETF, it is positively correlated to the ICE index compared to its sister ETF Direxion Daily Semiconductor Bull Bear 3X Shares ETF (SOXS), which is inversely correlated to the underlying index.
SOXS is up 64.63% this year since it moves 3X in the opposite direction to the ICE Semiconductor index. For SOXL stock to rally, we must get a rally in the underlying index, which at the moment seems like a dream given the recent market selloff amid concerns that the Fed’s rate hikes could lead to a significant economic slowdown or recession.
Retail investors should remember that SOXL and SOXS are not meant to mimic the long-term returns of the underlying index since their goal is to generate a 3X daily return. Therefore, those who buy the index should understand how it works even as they seek to multiply their profits, which automatically multiplies their losses.
*This is not investment advice.
SOXL stock price chart.

The SOXL stock price has fallen 83.27% in 2022 and could soon be due for a rally.


