Key points:
- Ethereum Merge Revisited
- Ethereum In The News
- Ether Chart and Forecast
The clock is ticking for the Ethereum Merge, with the date set for 15th September. This key development in the blockchain world has been anticipated for years, and as we move towards completion, speculation is high as to what it means for Ethereum and Ether. Here we revisit the Merge and look at current Merge news and speculation. Then look at potential bullish price prospects for Ether (ETH) into September and for the balance of 2022.
Ethereum Merge Revisited
The second largest blockchain by market capitalisation, Ethereum, is set to undergo a gigantic revolution known within the crypto world as “the Merge.” The Merge will transfer the blockchain from operating as a Proof-of-Work (PoW) to Proof-of-Stake (PoS) system, a key step to radically reduce power consumption. According to Ethereum.org, the Merge will reduce Ethereum’s energy consumption by ~99.95%.
Also Read: The Most Recession-Proof Cryptocurrencies
Ethereum In The News
The Merge has already significantly boosted ETH trading over the past month, and according to Coin Glass data, the number of Ether contracts that have not been settled has doubled to just over $8.43 billion. In addition, the Ether total derivatives volume was near $87 billion for September, more than that for Bitcoin at $67 billion.
But Brain Kelly, CNBC analyst, has warned of late that the Merge may be riskier than expected. In the latest episode of Fast Money, Kelly states;
“I think it’s probably more ‘sell the news,’ which is maybe not that intuitive because in crypto, you generally want to buy the news. But everybody has been buying Ethereum because they’re going into this Merge and now you’re going to get a so-called yield.
Just so you know, it’s not really a yield. You’re just getting your inflation rewards back, so it’s kind of offsetting the inflation in the currency. It’s not really a yield.”
Ether Chart and Forecast
So how has all of this speculation regarding the Ethereum Merge impacted on the Ether (ETH) chart, and what does it mean for the potential price forecast for Ether?
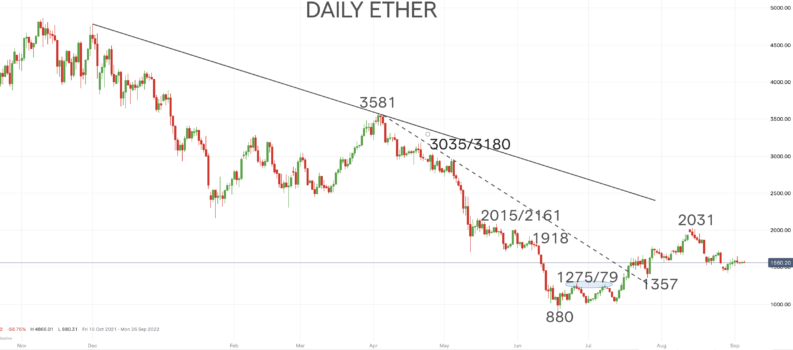
In a previous post, BTC and ETH Bullish Price Projections After CPI Leap, we highlighted the basing patterns that the major cryptocurrency benchmarks had produced since June, with strong gains posted above resistance levels into mid-August. Subsequent Ether losses since then have only very modestly damaged these positive bottoming signals, but with notable support levels intact, the intermediate-term basing and recovery theme remain fully intact.

Whilst holding above the latter July swing low at 1357, the ETH chart remains in a bigger recovery rally phase, with intermediate-term swings to higher highs and with higher lows very much intact. Moreover, the previous push above resistances at 1275/79 and 1918 into our 2015/2161 resistance area, to 2031, indicates potential for a renewal of upside forces into September and Q4 2022.
Whilst holding above 1357, we see a renewal of bull pressures to challenge 2031 and 2161. Then into Q4, maybe see upside risks towards 3035/3180 targets.


