Shares of British semiconductor manufacturer IQE plc (LON: IQE) are up 9.32% this year after the company released upbeat full-year earnings results on 20th January. Overall, IQE shares are up 32.9% over the last six months and 44.33% over the past year.
Many investors wonder whether the company’s good luck has run out following last year’s impressive run, but this couldn’t be further from the truth.
IQE’s excellent results were driven by strong demand for the semiconductor wafers it manufactures, and demand is projected to be much higher this year.
The company’s management expects to generate more revenues in 2021, driven by the strong demand for its semiconductors is.
As technical traders, we base our trading decisions on analysing an assets price chart to minimise our risk exposure, identify opportunities and close our trades strategically to bank the most profits.
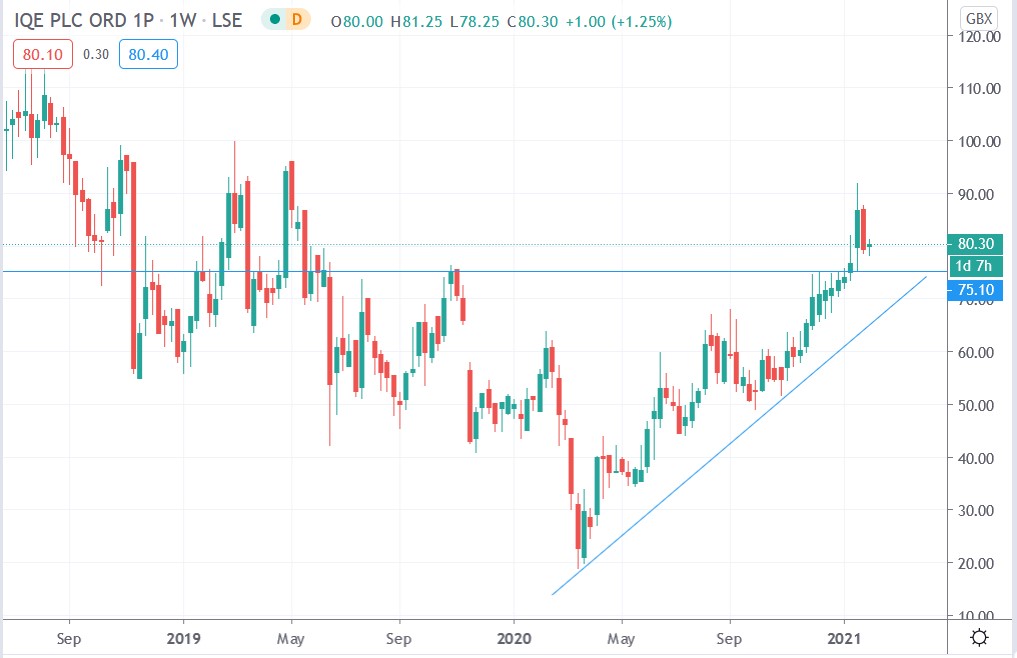
According to the IQE weekly price chart below, we can see that the price has formed an ascending triangle pattern since bottoming on 23 March 2020, and has recently broken above a key resistance level.
Interestingly, we can see that it formed a pre-breakout structure for six weeks before breaking above the resistance level, which is a very bullish signal. The stock broke above the resistance level and then retested it last week.
The current setup indicates that a major rally could start if the price continues to hold above the 75p level, and bullish traders might find that now is a good time to establish new positions in the stock.
However, the trend would be invalidated if the price breaks below the resistance level and heads lower for a couple of weeks.
IQE share price.

IQE shares have formed an ascending triangle pattern and recently broke out, the chart shows potential for more gains.


