
- Gold has continued its recent bull-run and the price has topped $1,619 per ounce for the first time since 2013. Up 3.6% at the end of last the week, the metal looks likely to post its best weekly return since August.
- The bullion market has always been attractive to speculators. The sustained periods of price volatility are creating opportunities to catch long term trends.
- There are many ways to trade the market, ranging from buying in physical form and to equities in miners.
- As more look to gain exposure, there is a case to be made that traditional explanations of gold’s pricing mechanisms could do with an overhaul.
Trading in gold can generate excessive profits or lead to traders getting severely burned. Price moves, such as the one seen last week can be dramatic. The extreme move even stands out on the following monthly chart, which covers several years.
Gold — monthly candles — August 2012–February 2020:
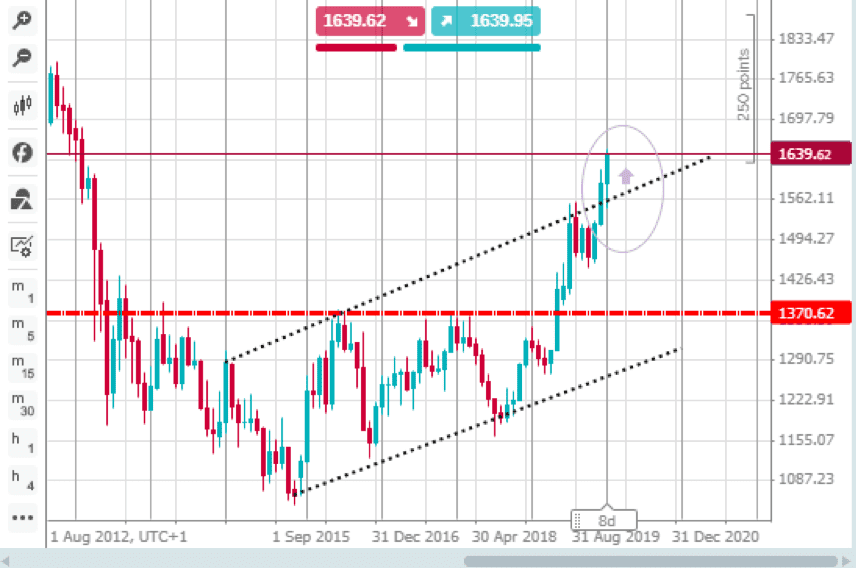
The break might offer an opportunity to review the cause of the move. Some disconnect between price, and the factors traditionally used to explain price point to a large part of the current move being down to an influx of speculative money. A profit is a profit, but greater understanding can help protect and enhance gains.
With price currently in the region of $1,642/oz, reports explaining the seven-year high are following a traditional narrative. Factors referenced include traders seeking security against the threat of coronavirus, the shadow of the US-China trade war and concerns about a global recession. With the latter being priced in dollars, this means that gold follows moves in that currency. While there is still some risk that the coronavirus situation may yet deteriorate, from an epidemiological standpoint, it is possible to argue that the disease is following the same path as the SARS outbreak, which was ultimately contained. The extent of knock-on economic effects is harder to analyse, but the coronavirus-based news has on the whole been far from alarming during the time of gold’s break out. The trade-war and recession risks persist but have gained little more airtime than normal. The US dollar has shown strength, but there is also a case to be made that the link between gold and the dollar is not as strong as some claim.
Gold — daily candles — 17th December 2019–21st February 2020:
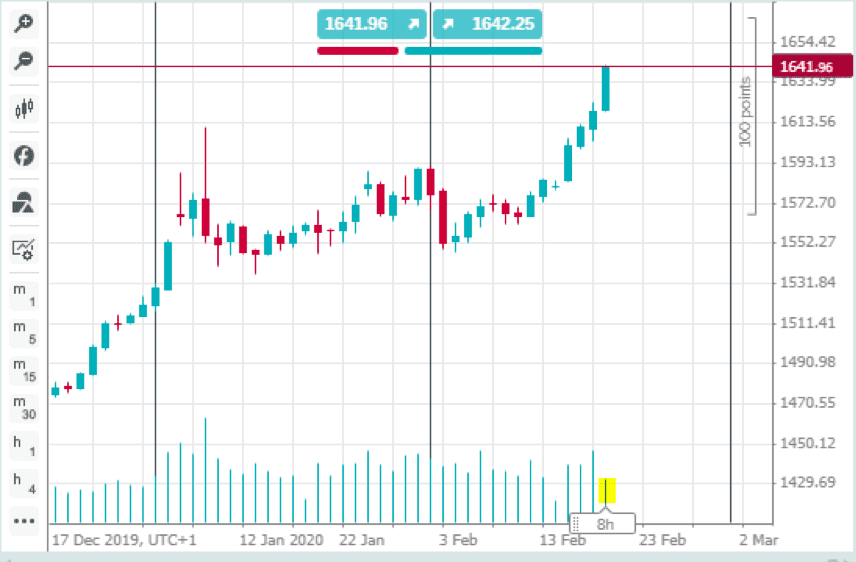
The daily bar above shows a price move that, intra-day, equates to a 1.52% price hike. Gold markets are notoriously volatile, but a shift of this scale still manages to stand out.
Although it’s possible to explain the burst through major resistance levels using conventional methodology, to some, it looks like gold is just the hot market to trade at this moment. The breakout can, therefore, be attributed to speculators jumping into a trending market. The absence of any spike in trading volumes (yellow on the chart) is another sign that the established explanation might need a to be double-checked. Such upward pressure without a confirmatory jump in trading volumes suggests an absence of sellers.
The market isn’t showing signs of a showdown between bulls and bears, more an absence of any second wave of selling pressure, which is allowing price to move higher.
Gold — daily candles — 17th December 2019–21st February 2020:
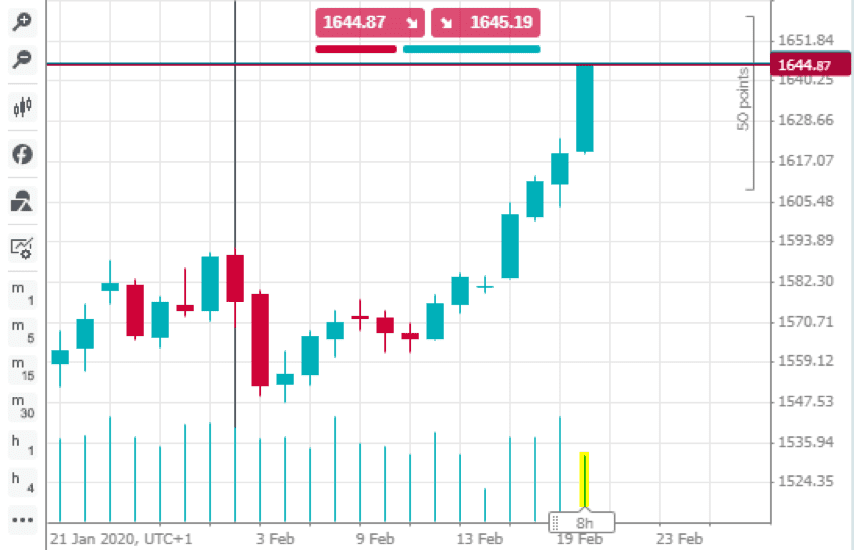
Break out
Technical indicators pick out the break of the $1,619/oz as being highly significant. This followed another super-bullish move when the long-term resistance of $1,370/oz was broken after several years of consolidatory price action.
Gold — daily candles — 21st January 2020–21st February 2020:
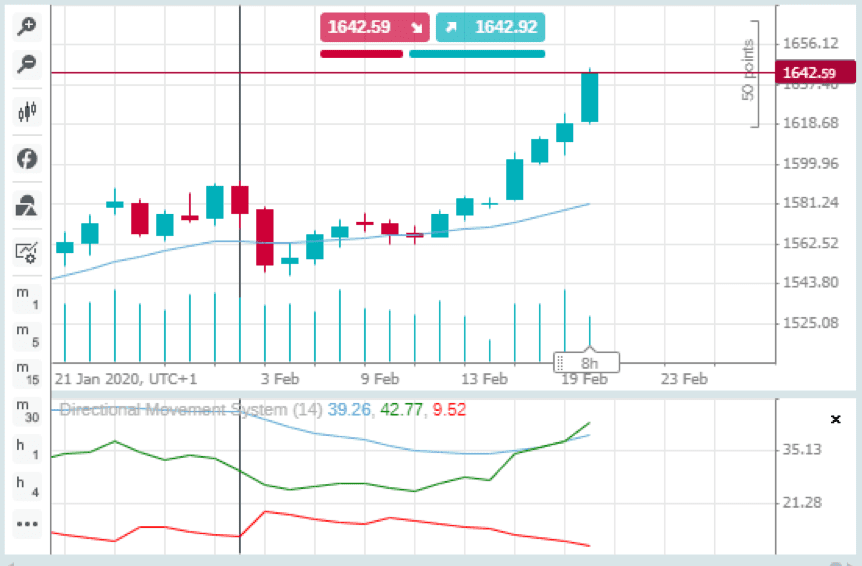
Directional movement system (14) Simple moving average (20)
Source: cTrader
Given that speculative buyers can drift out of a market as quickly as they pile into it, the temptation to pick the top of the market and go short remains.
As ever, timing will be everything for those looking to catch the next downward retracement pattern and, for now, at least, there are few technical signs that the bull run is running out of steam.
Trading gold
The other means of gaining exposure to gold are also seeing breakouts to higher prices.
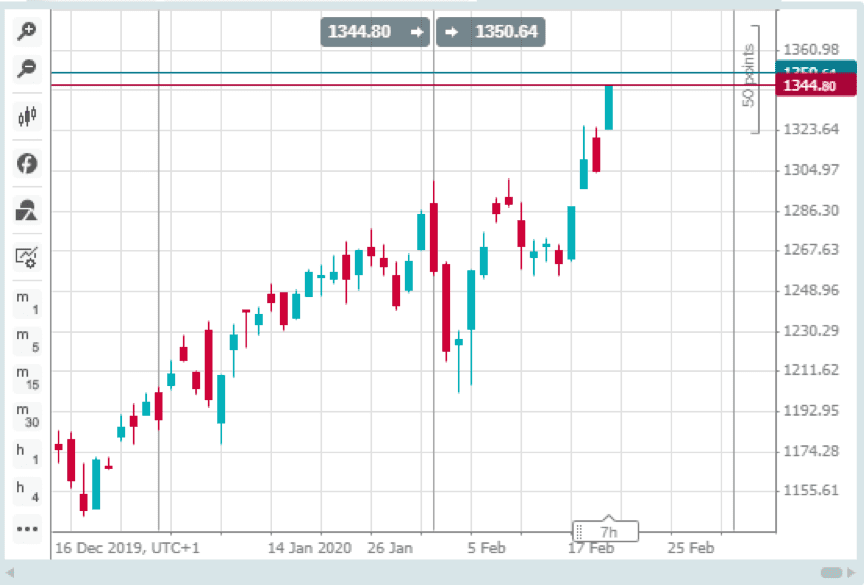
The share price of London Stock Exchange-listed firm, Polymetal, has since the middle of December 2019 gone up in a straight line.
Polymetal share price — daily candles — 16th December 2019–21st February 2020:
ETFs covering gold are another angle into trading the metal and there are also the ‘old-school’ methods of buying and holding the metal in bullion form or as jewellery. The many means of accessing the ‘trade’ are important to keep in mind because they add nuance to the explanation of why prices move.
The different angles that are available to trade gold highlight the asset’s role in the common psyche. The public connection with the metal can bring about further buying pressure once stories of a ‘run on gold’ move out of the financial media and into mainstream reporting. Signs of the dramatic price rise reaching a wider audience might indicate a buying opportunity to ride that second wave of interest.
Edward Moya, a senior market analyst at broker OANDA provides an explanation that many might buy into. Speaking with CNBC, he said:
“Markets are once again anxious because the coronavirus outbreak is possibly spreading outside China. There is huge amount of safe-haven demand as economic slowdown in China, Japan and Germany is expected to persist in the first half of the year.”
Source: CNBC
Dollar disconnect?
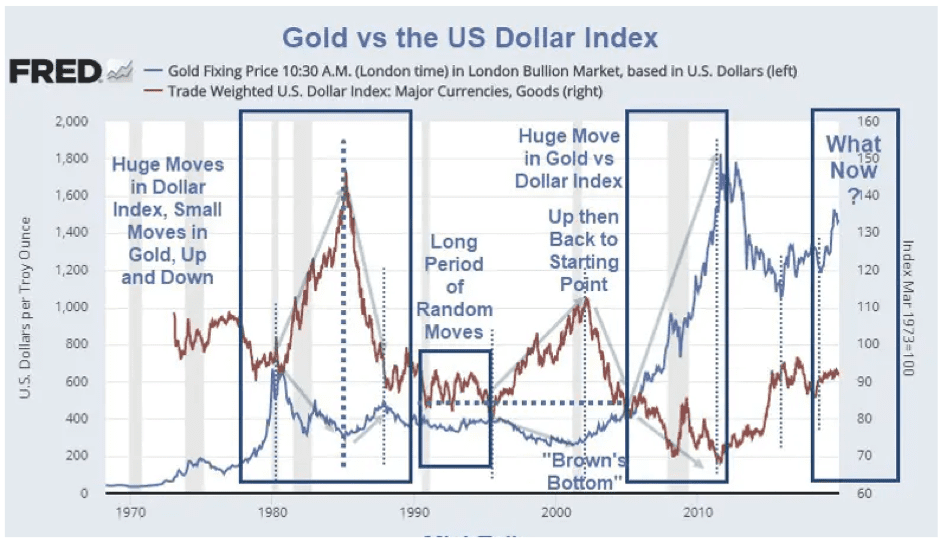
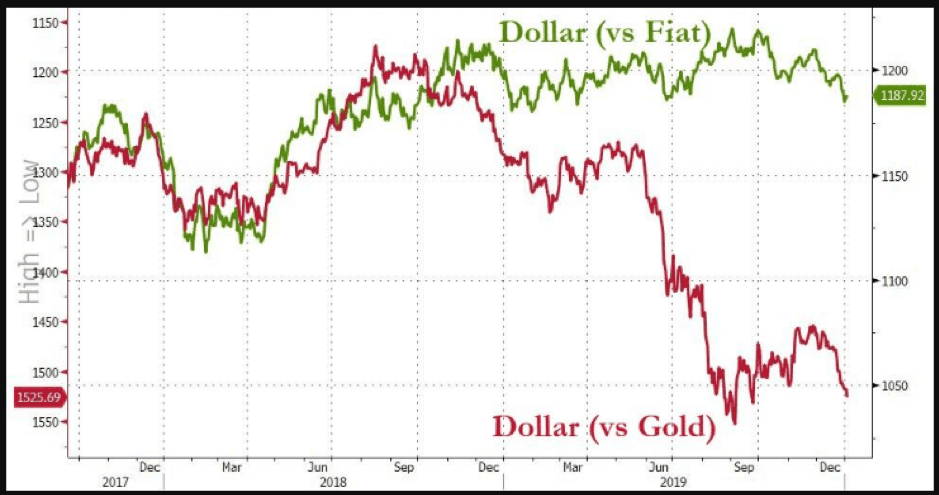
Explaining gold’s price surge in terms of a retreat into US Dollar may not be as conclusive as traditionally thought. The argument that gold tracks the USD is challenged by periods of time where the relationship breaks down.
Gold vs US dollar:
Dollar-gold vs dollar fiat:
Timing
The current move looks very much like hot money flooding a market and combining with a short squeeze. From a fundamental viewpoint, the strongest case for the move is the increased likelihood of interest rates falling, or at least not rising, in the near future. With returns on cash at such low levels, the opportunity cost of holding the metal (and foregoing interest returns) is negated.
The extra volatility brings trading opportunities and depending on investment timeframe, a chance to trade either direction. Capital Economics has a 2020 year-end target price of $1,400/oz. Their bearish take on the situation is a warning for those looking to catch the ride.
“We retain our view that a softening in safe-haven and consumer demand will cause the prices of gold and silver to fall back in 2020.”
Source: Capital Economics
On the other hand, Citigroup issued a note last Wednesday, which upgraded its six-to-12 month price target for gold to $1,700/oz and upgraded its 2020 base case average gold price forecast from $1,575/oz to $1,640/oz. The same strategists also predict fresh nominal highs of $2,000/oz to be breached in the next 12 to 24 months.
Even if this is a point where it’s too late to go long and too early to go short, the market could be about to generate some form of shorting opportunity.


