Want to invest in a trend that can be associated with a 10-year-plus bull market? One which provides a hedge against uncertainty impacting other parts of your portfolio? Commodity supercycles could be for you, and one of these relatively rare, multi-year, money-making opportunities could be just about to form.
The commodity markets have experienced four periods of exceptional sustained price growth. The first occurred in the 1880s, then three more followed in the years between 1933-50, and again during the 1970s and the 2000s. Not only does it feel like the next one is due, but the supply and demand factors we’ll consider below are aligning to point to one forming right now.
Get into commodity positions too early, and you could wait in positions for years. That might not be the worst trading decision of your career – mining stocks are known to pay healthy dividends. On the other hand, missing out on a supercycle can lead to a severe and long-term case of FOMO. The below breakdown of the current global landscape and historical reference points offers ways to optimise the timing of your commodity supercycle investments. Regardless of your level of trading experience, now is the time to be taking action.
What is a Commodities Super cycle?
A commodities super cycle is defined as an extended period of price rises in commodity markets due to strong demand growth and supply restrictions. They can last for more than a decade because supply constraints take years to resolve.
Producers who would like to profit from higher prices just can’t scale up their production levels fast enough. At the same time, demand can be driven by massive and irreversible transformational changes in the global economy.
It’s a perfect storm for those manufacturers and consumers caught on the wrong side of the market, but for investors, it can be an opportunity to make significant long-term returns.
Previous Supercycles – Charts & Characteristics
Historical context is critical when studying commodity markets, as previous case studies can help predict future price moves. Not least because a lot of the geopolitical and macro-economic factors which drove the previous commodity supercycles appear to be coming around again. If scanning through the details of the earlier cycles makes you think that the conditions appear similar to what we face now, it’s because they are.
- The 1880s – This decade marked the emergence of a new economic powerhouse – the USA. It also corresponded with dramatic technological advances and the industrial revolution. For analysts considering the markets in 2022, it’s easy to draw parallels to the rise of China and a shift to low-carbon economic production causing a transformational change in the global economy.
- 1933 – 1950 – A supercycle caused by rearmament in the build-up to WWII and post-war government support. With geopolitical risk re-emerging as a significant factor influencing market prices, it’s again easy to spot similarities between then and now.
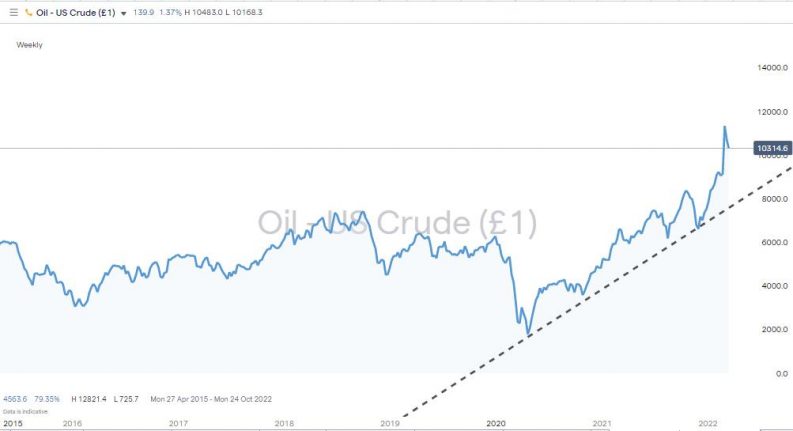
- The 1970s – The oil price shock inspired by the forming of OPEC sent shockwaves through all the financial markets and sent inflation and commodity prices skyrocketing. Fast-forward to 2022; crude oil prices have risen from nearly zero in 2020 to over $100 per barrel.
- The 2000s – Outstanding economic growth in BRICS countries acted as a catalyst for a surge in commodity prices. Move on 20 years, and India is forecast to have the largest population in the world by 2025 and could be about to make the most of its economic potential.
Does Price Action Point to a Commodity Supercycle Forming?
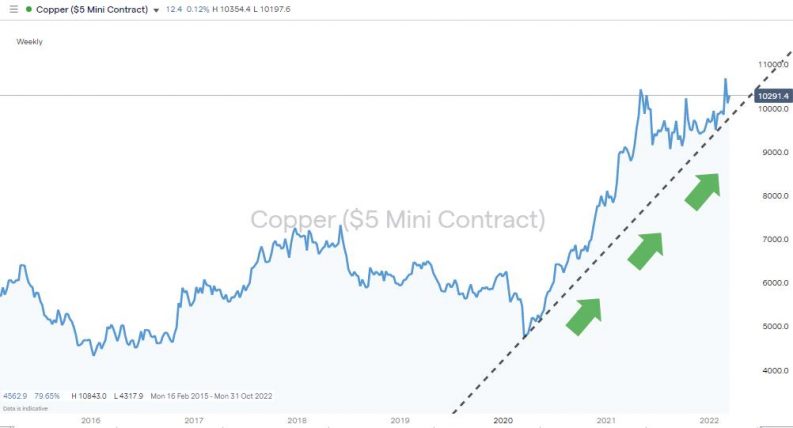
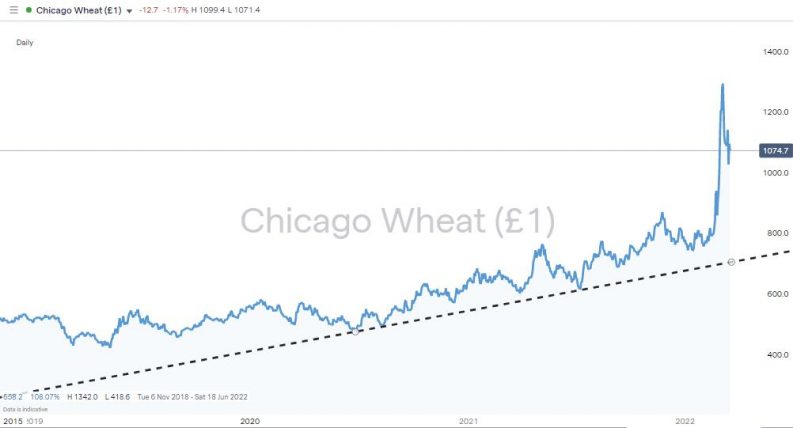
Proponents of technical analysis use historical price data to spot future trends, and the price charts of copper, wheat, and oil show long-term price strength and recent price surges. As the below fundamental analysis style factors support the move, this points to opportunities to use breakout and momentum trading strategies to make returns on the move.
Copper Price Chart – 2016 – 2022 – Breakout
Source: IG
Chicago Wheat Price Chart – 2016 – 2022 – Breakout
Source: IG
US Crude Oil Price Chart – 2016 – 2022 – Breakout
Source: IG
Demand Factors That Suggest a Commodity Supercycle is Forming Now
The analysis of demand for commodities needs to factor in an additional layer of complexity. This is due to the buyers involved consisting of two distinct groups. The first is the manufacturers who require commodities in physical form to be able to carry out industrial production. The second comprises investors and speculators looking to trade the sector for financial returns.
If, and when, prices start to head upward, a sense of panic among manufacturers can result in them scrabbling around to find enough materials to meet their needs. Those price hikes result in a second wave of speculative buying, and a self-supporting cycle of increased buying pressure is established.
Base Level Demand for Commodities is Increasing
A new wave of emerging countries are experiencing increased economic growth and are taking global aggregate demand for commodities to new levels.
Credit agency Moody’s has forecast India will achieve economic growth in 2022 of 9.1. The IMF predicts that economic growth across Africa will be 3.8% in 2022, and before COVID, expansion rates were expected to be 5.5%.
Growth in emerging economies can involve building huge infrastructure projects that require massive amounts of commodities. The early 2000s was a period when Brazil, Russia, India, China, and South Africa (the BRICS) took a step up in economic development and is widely regarded as a trigger of the last commodities supercycle.
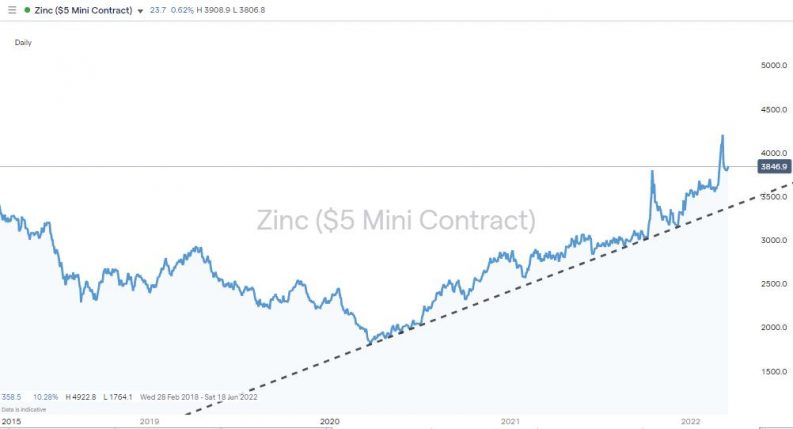
Zinc Price Chart – 2018 – 2022 – Sustained buying pressure
Source: IG
The Building of a Global Low-Carbon Economy
In recent years a stronger global consensus has been formed on the need to shift away from carbon-based fuels, with governments, central banks and big corporations all behind the move. The next phase of the project involves an overhaul of the world’s existing infrastructure networks.
Ironically this massive investment programme represents an enormous drain on the world’s resources over the coming years. Commodities needed for the rebuild range from the copper and nickel required for electric vehicle batteries to the steel required to build wind turbines. Uranium will be needed to power nuclear power stations, which look to be the best way of securing a sufficient base-load of electricity and tidal energy firms face the task of building their operations up from scratch.
Inflationary Pressures and Commodity Prices
Record low-interest rates and quantitative easing programmes have resulted in inflation well and truly being let out of the bag. Periods of high inflation have historically been associated with increased commodity prices. Some investors buy commodities to hedge against further price rises because a position in an asset such as copper is seen as holding its value better than cash at the bank.
China’s Deflationary Policies Are On The Way Out
Beijing’s plan to achieve global economic dominance has been based on the government’s ability to suppress the value of its currency and capitalise on its large and relatively cheap labour pool. The project’s success means both of these are now harder to manage. The booming Chinese middle class can demand higher wages and are in a position to spend the capital they built up over the last decade.
According to the National Bureau of Statistics, China’s factory-gate inflation hit a 13-year high in August 2021, and the year-on-year increase was an eye-watering 9.5%. Snippets from the same report include a 57.1% increase in prices in the coal mining and washing sector.
Which Supply-Side Factors Suggest a Commodity Super-cycle is Forming Now?
Commodity supply chains are global in nature. A soya bean harvested in Argentina is similar enough to one farmed in the USA for them to be considered interchangeable. That means disruptions to supply can come from every angle. Many of the supply-side price drivers are already pointing towards a commodities supercycle forming, and below is an analysis of the influence each one might have.
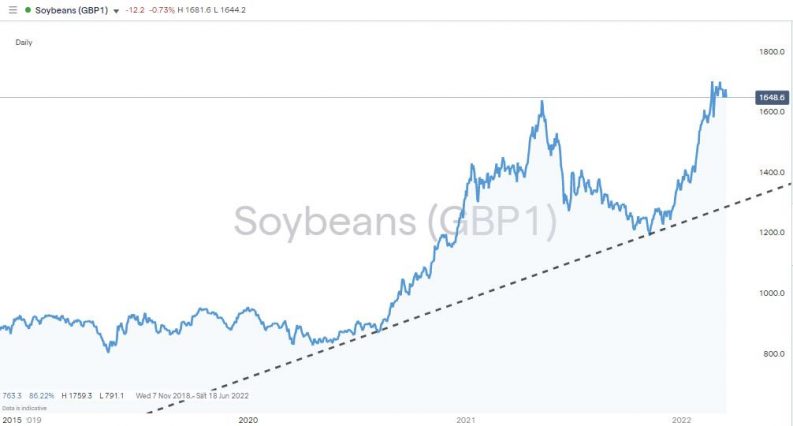
Soybeans Price Chart – 2018 – 2022 – Sustained buying pressure
Source: IG
The Impact of Climate Change on Commodity Prices
Analysts of the soft commodity markets note how global warming impacts crop yields.
The Intergovernmental Panel on Climate Change (IPCC) reported in 2020 that,
“At around 2°C of global warming the risk from permafrost degradation and food supply instabilities are projected to be very high (medium confidence)”.
Source: IPCC
The report points out that a rise in global temperatures of only 1.5°C would likely increase price volatility in soft commodity markets.
“Risks from droughts, water stress, heat related events such as heatwaves and habitat degradation simultaneously increase between 1.5°C and 3°C warming (low confidence).”
Source: IPCC
Military Conflict as a Catalyst for Commodity Price Increases
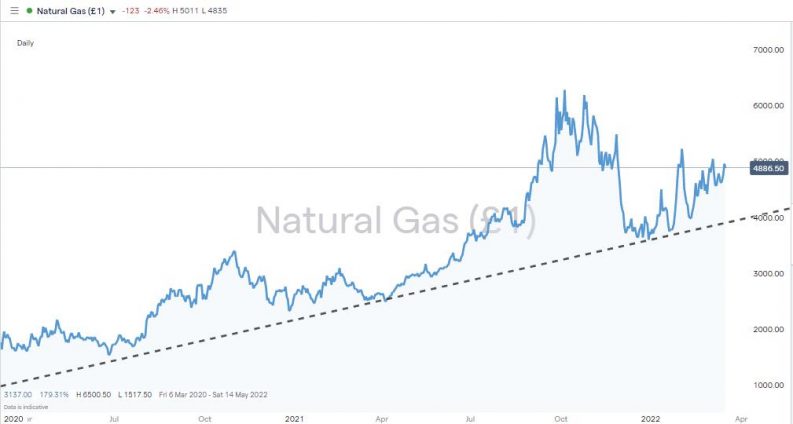
With a worsening global geopolitical climate dominating the news headlines, military conflict has the potential to play an increasingly important role in determining commodity prices.
Natural Gas Price Chart – 2018 – 2022 – Trendline Support
Source: IG
Cyclical Lack of Investment in New Mines
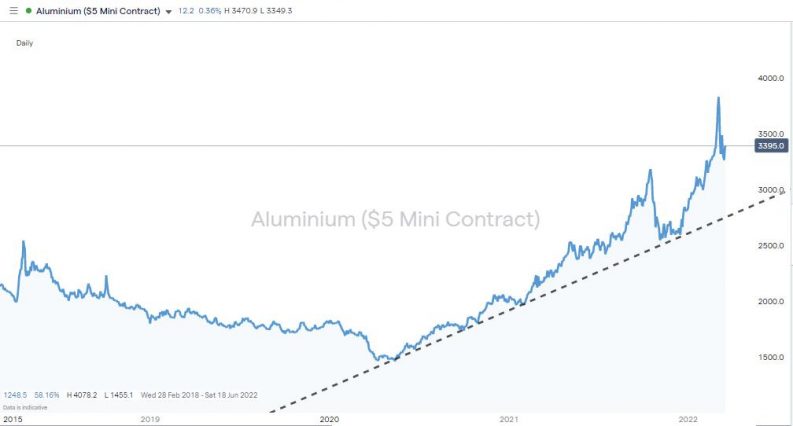
It’s thought to take more than ten years to bring a new copper mine into production. Higher metal market prices incentivise mining firms to expand production and increase profits, but developing the required capacity is logistically challenging and time-consuming.
The mismatch between demand, which can change instantly, and supply, which takes years to adjust, has always been a significant issue for the mining sector. It played a part in all the previous supercycles and looks like it’s beginning to become a key price driver once more.
Aluminium Price Chart – 2018 – 2022 – Trendline Support
Source: IG
Mining Firms are Suffering from Long-COVID
The outlook for mining firms and commodity prices was very different just two years ago. The mining sector was one of the big losers during the global lockdown as prices crashed due to normal economic activity grinding to a halt. Social distancing guidelines for staff and problems with supply chains also played a part in making mining a much less efficient process.
These factors combined to form an existential crisis for mining firms, which were left with little option but to protect their balance sheet and scale back on investment in exploration and development of new mines. That bottleneck in the supply process will take years to work through and is already playing a part in driving metal prices higher.
Final Thoughts
Commodity supercycles are rare events but hold a special place in the investment community thanks to their potential to generate significant returns over the long term. Timing your trade entry point to the exact day that forms the bottom of the market is incredibly hard to do and frankly not necessary. Working into positions over time can be as effective a strategy and still result in substantial gains. Buying dips along the way using a pull-back strategy is another approach to consider.
Working out of positions gradually at the end of the supercycle is also recommended. The extra supply coming online and weakening demand can take some time to feed through into prices and the market ultimately turning. This means knowing the exact date when the market turns is also unnecessary. Instead, catching the commodity supercycle is about trading with the trend and applying patience.
Like other commodity supercycles, this one will inevitably one day end. Still, whether you are a complete beginner or experienced trader, the priority now is trading the market in front of you. Navigate to this list of trusted brokers who offer ways to buy into commodities and take a position on a market phenomenon that only occurs approximately every 20 years.


