
One challenge facing new investors is they have to simultaneously juggle the fear of missing out and the fear of not doing anything at all. Considering the pros and cons in that way isn’t necessarily a bad thing as it opens the door to using strategies that aim to optimise returns by trading sensibly. Researching the market, keeping up to date with tech upgrades, and following market news are all important. But when considering the best time to buy crypto, a lot comes down to developing a trading mindset.
Be Realistic When Timing Crypto Trades
If you’re looking to invest in crypto, then you’re probably aware of the staggering profits some coins have returned to their investors. Some of the smaller altcoins, such as Dogecoin and Shiba Inu, made headlines in the mainstream press following dramatic price moves in 2021. Dogecoin, for example, doubled in value overnight between January 28th and 29th 2021, and by May of that year, it had increased in value by 9,884%.
When considering the best time to buy cryptos, the first step is to be realistic about the possible returns on your trade. Picking the bottom and top of markets is notoriously difficult. Changing approach and focussing on signals which point to a good time to enter into a trade might mean your returns are slightly less than the near 10,000% offered by Dogecoin in 2021, but there’s still enough juice in any trade like that even if you do instil a bit of discipline in your strategies.
How To Buy Crypto Using Averaging In Strategies?
The principles behind strategies that use averaging in techniques is relatively simple. They apply an approach that involves gradually building up position size by buying coins at regular intervals.
In this instance, there isn’t necessarily a best time to buy crypto, but more a best time period in which to do so. Remembering the trading floor adage that ‘only monkeys pick bottoms’ can help traders get over the bump of wanting to place the perfect trade. Sometimes time in the market can be better than timing the market.
The VWAP (Volume Weighted Average Price) model can help those looking to ease into crypto positions at a low average price level. Good online brokers offer this indicator as part of their default package and the time frame involved can be set according to individual preference. Day traders use a VWAP set at a very short level, maybe minutes or hours. If your strategy is more buy-and-hold in nature, then using days or weeks as the determining variable will help you enter into trades designed to come good over a longer timeframe.
One important feature of VWAP is that it is widely used by institutional investors. To some extent, the VWAP price in a market is seen as the ‘real’ price as big banks and funds track its progress and like to buy when live price is below VWAP and sell when it is above. Trading in the same direction as organisations with billions of dollars to invest is always a good thing.
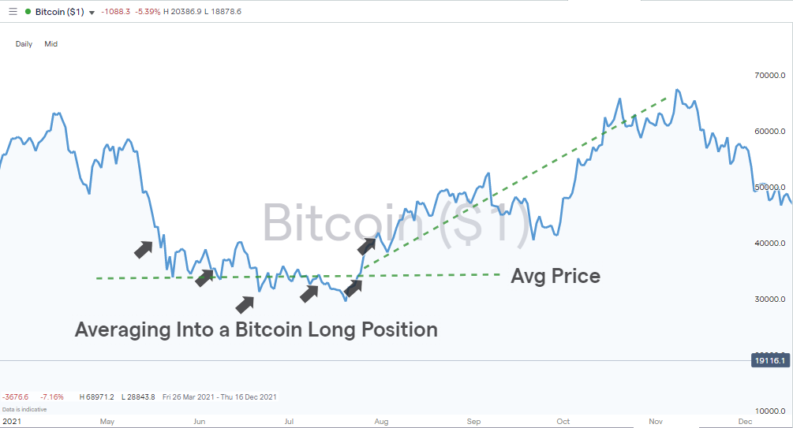
Bitcoin – Daily Price Chart – 2021 – 2022 – VWAP Averaging In
Source: IG
VWAP trade signals work equally well in rising and falling markets. The above chart shows trade entry points for a VWAP strategy and illustrates how buying into a position over time results in trade entry points during both the initial price fall and subsequent period of upwards momentum.
Crypto Trading Using Pullback and Fibonacci Retracement Strategies
The crypto market rout of the first half of 2022 highlighted how difficult it is to spot if a price slump is part of a temporary correction or a long-term trend. During that pullback, which impacted the entire crypto sector, Bitcoin lost 35.8% in value between January and June, while the price of ETH fell by 50.72%.
Such market moves can be scary moments for those already holding positions, but new entrants also need to take care. One way to navigate the price swings and establish if now is the best time to buy crypto is to use pullback and Fibonacci trading strategies.
These strategies can help traders put on trades that could post substantial returns, but timing is everything. As a result, developing a hybrid strategy, which uses Fibs and pullback indicators, but also applies a VWAP approach, can limit risk and smooth out returns.
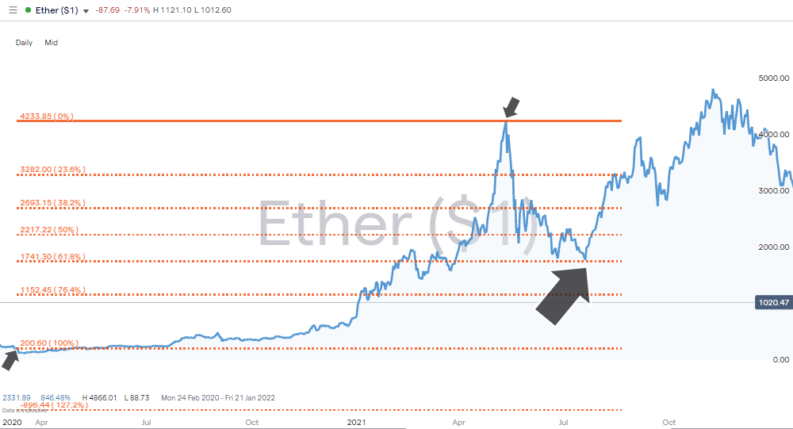
Ethereum Price Chart – 2020 – 2021 – Fibonacci Trade Entry Points
Source: IG
In the above price chart, Ethereum shot up in value by more than 2,000% between March 2020 and May 2021. The subsequent pullback saw the price drop as low as $1,741 on 21st July 2021. At that point, the support offered by the 61.8% Fib retracement level kicked in and price rebounded. Anyone who bought at that low point would have doubled their money within two months.
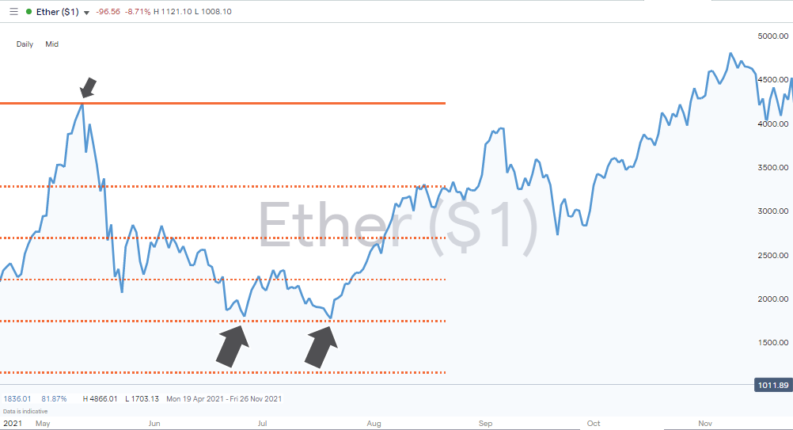
An interesting note for those looking to find the best time to buy crypto is offered by the Ethereum price chart, including a second indicator, which can be used to enter into trades – a double bottom price pattern.
The price of ether reached the level of the 61.8% Fib in June of 2021. It bounced slightly but then revisited the 1,741 price level. When it bounced again, price from a technical analysis perspective confirmed that the previous sell-off had run its course and that buyers were set to dictate market momentum for the foreseeable future.
Not all pullbacks are marked by double bottoms but the greater the number of indicators pointing in the same direction, the more reliable a trading signal can be seen to be.
Ethereum Price Chart – 2020 – 2021 – Double Bottom
Source: IG
Using Momentum Indicators To Find The Best Time To Buy Crypto
Our hunt to find the best time to buy crypto has so far focussed on retracements and chances to buy the dips, and VWAP as a practical means of entering into trades. In crypto markets, in particular, it is also important to consider momentum indicators. These work on the basis that trading in the same direction as the trend is always a good idea, and in crypto markets, the price rises associated with those moves can be staggering.
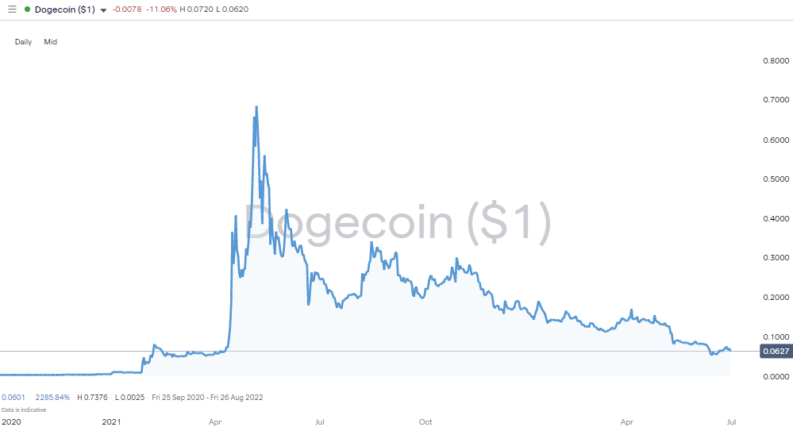
The previously mentioned extreme price move posted by Dogecoin in 2021 highlights how a market can suddenly surge in one direction. In the case of DOGE, the catalyst for the move was a Tweet from Elon Musk about the coin’s potential. Musk’s many followers piled into the previously low-profile coin and upwards momentum continued until 7th May 2022 and the price of Dogecoin hit an all-time high of $0.732.
Dogecoin Price Chart – 2020 – 2022 – Momentum Trading
Source: IG
Spotting a trend and finding a way to buy into it are slightly different things. In the case of Dogecoin and some other cryptos it’s hard to argue with anyone who made a significant profit from just throwing on a position. However, there are ways to finesse the situation.
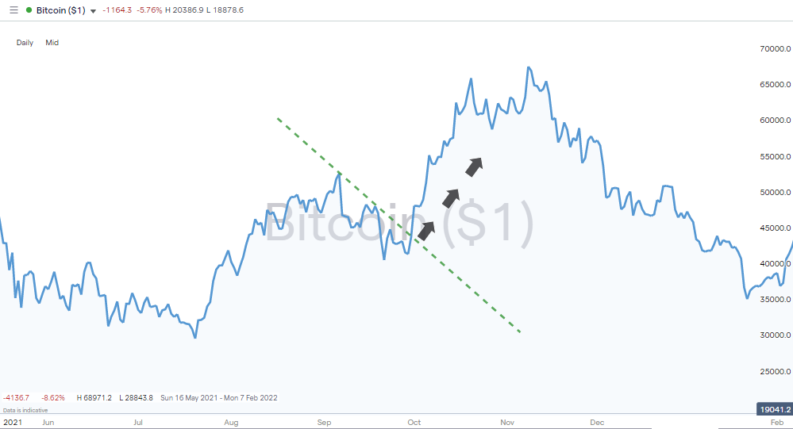
Breakout and trendline strategies can be used to identify the moment a crypto is ready to break out to the upside. In the below Bitcoin chart taken from 2021, the period of price consolidation ended on 1st October when price broke through the downwards trend line. Those who entered into trades on the back of that trading signal had, by 21st October, posted a profit of more than 50%.
Bitcoin Price Chart – 2021 – 2022 – Trendline Breakout Strategy
Source: IG
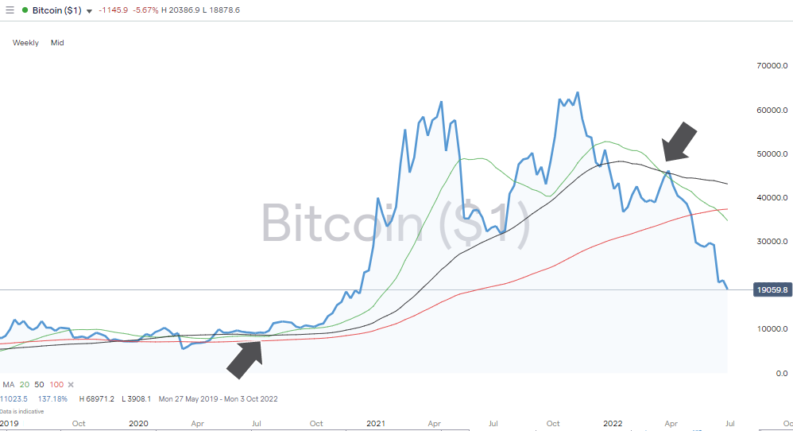
SMAs (Simple Moving Averages) are metrics that are widely used to spot crypto trade entry points and as an ongoing measure of the strength of momentum. In the below daily price chart for Bitcoin, the 20 SMA intersects the 50 SMA to the upside in July 2020. To put it another way, price action in the last 20 days has been stronger than in the last 50. A trend was forming and taking that as a good time to buy Bitcoin would have resulted in a 576% return by April 2021.
While the green line of the 20 SMA remained above the longer-dated SMAs, continued upward momentum was confirmed. All trends have a bend in the end, and in the case of Bitcoin, the downwards intersection of the 20 and 50 SMAs occurred on 14th March 2022. At that point, Bitcoin was already falling from the highs of November 2021, but the SMAs, move acted as an indicator that momentum had turned negative. By the end of June 2022, the price of Bitcoin had fallen a further 59%.
Bitcoin Price Chart – 2019 – 2022 – 20, 50, and 100 SMA on Daily Price Chart
Source: IG
Momentum and pullback strategies can be used in conjunction. In the above trade example, there was a single trade entry point in July 2020, but moments when price retraces to touch a moving average can be seen as opportunities to buy the dip – as long as the longer term upward trend is confirmed.
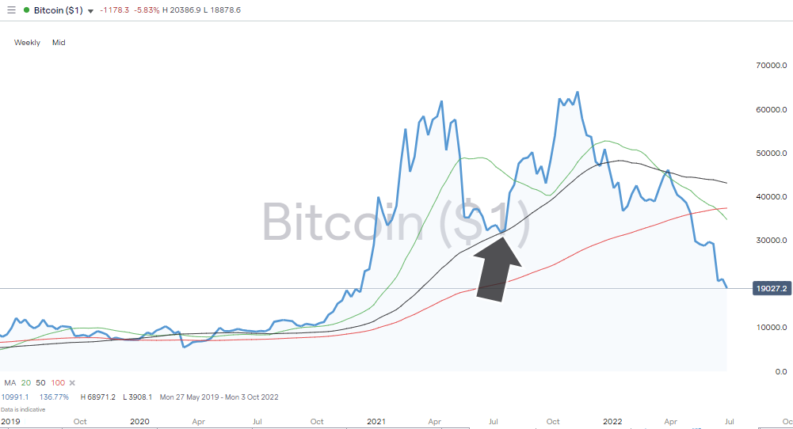
The 20, 50 and 100 SMAs are the most commonly used date ranges and that means a lot of investors will be making the same decision. The pullback during July 2021 saw the price of BTC clip the 50 SMA, and then rally hard.
Bitcoin – 2019 – 2022 – 50 SMA on Daily Price Chart
Source: IG
The starting point of our analysis on what is the best time to buy crypto started by explaining that trying to land the perfect trade might not be the optimal approach. This is particularly relevant when using momentum trading strategies. Buying too early using a false signal can result in a losing trade. Instead, waiting for a trend to be confirmed and then buying into it can improve your win-loss ratio. Some of the most successful traders are those who specialise in momentum strategies and who join the party late and leave it early.
Final Thoughts
There isn’t a foolproof way to find the best time to buy cryptocurrencies. You can take measures to stack the odds in your favour. If your fundamental analysis makes you think the long-term prospects of cryptos such as Bitcoin are still strong, and that pullbacks in price are part of the natural workings of the market, then sell-offs can be seen as opportunities to buy the dip. Applying strategies based on technical analysis can then help you find the optimal time and way to buy into the market.
Whether you are a novice or an experienced trader, it is important to consider the risks. These relate to price, but also broker selection. Crypto markets are, after all, unregulated, so choosing a broker from this shortlist of trusted crypto brokers is particularly important. Signing up with a reputable broker will put you in the best position to make the most out of buying crypto, it’s then just a case of learning how to time your trades right.


