After several years of being generally overlooked, and with London listings being questioned on a value perspective, UK stocks are returning to favour.
The rotation into UK stocks is about more than investors becoming risk averse. One of the best categories to invest in to protect against inflation are the value stocks listed on the London Stock Exchange. The stocks listed below, identified using fundamental and technical analysis techniques, are seen as being among the best UK stocks to invest in now.
Best UK Stocks – A Shortlist
LON: SHEL
Oil and gas producer Shell PLC looks set to continue benefiting from the seemingly never-ending bull market in energy commodities. Harmony among the members of OPEC has allowed them to set global production at levels that optimise their returns. At the same time, the conflict in Ukraine continues to mean global energy prices remain high.
SHELL PLC – DAILY PRICE CHART – 2022-2023
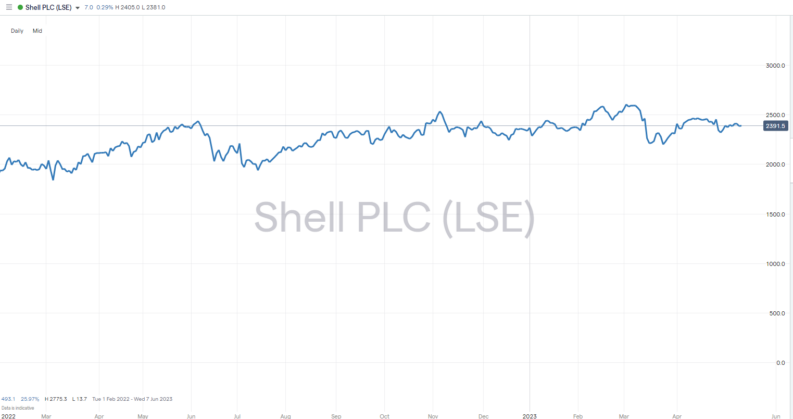
In Q1 2023, Shell announced that it had posted earnings of £8.7bn, representing a 22.39% increase on the previous year. A lot of that cash is being returned to investors, generating a strong base level of support for the stock. The shares currently have a dividend yield of 3.86%, and there is also a 4.0bn share buyback programme to factor in.
The Shell share price could ultimately come unstuck if it doesn’t convert its core business processes from carbon to being renewable energy based. However, that is currently priced in, and the eye-watering income streams that the firm is presently generating put it in the best possible position to complete the required restructuring.
LON: RIO
Multinational mining firm Rio Tinto is well positioned to benefit from commodities providing a hedge against inflation. The firm’s mineral resources tend to keep up with price rises; a ton of copper is a ton of copper, regardless of what is happening in the financial system. As long as its products are still in demand, the firm is relatively immune to whether the unit price is $10, $100 or $1,000.
RIO TINTO PLC – DAILY PRICE CHART – 2017-2023
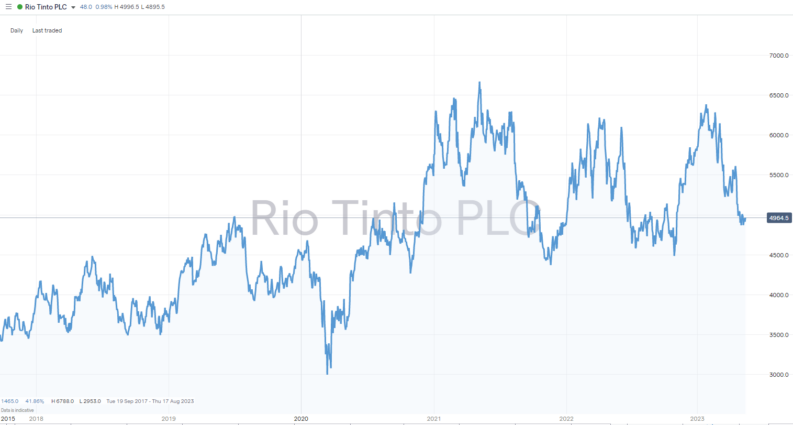
The good news for Rio Tinto shareholders is that demand for the copper and iron ore the firm produces will hold up regardless of how long the current inflationary bubble lasts. The restructuring of global transport infrastructure and a move towards using cleaner energy is a government-backed programme expected to take decades to complete.
Building those new wind farms, EV charging facilities, and other green energy projects will all require the materials Rio Tinto produces and ships to its global client base. The strong position that Rio Tinto enjoys in terms of the ‘new economy’ is bolstered by the firm holding significant lithium reserves, making it one of the best lithium stocks to buy now.
One demonstration of the health of the sector and Rio Tinto’s balance sheet is the impressive 6.55% dividend yield that RIO stock currently offers. That alone is more than current inflation rates making the stock and its 9.46 P/E ratio irresistible.
One notable fan of Rio Tinto stock is Mad Money’s, Jim Cramer. He’s one of a group of high-profile investors who see the current pullback in stocks as a chance to buy the dips, and Rio Tinto is one of his favourite targets. “I like Rio Tinto. Buy, buy, buy. It’s minerals. Remember, there’s a bull market in minerals, and I embrace it.”
Source: Jim Cramer
LON: FERG
UK-based Ferguson PLC distributes plumbing and heating products and has a strong position in the North American market. The international sales that the firm makes mean that it’s well-positioned to benefit from any further weakness in the GBPUSD and GBPCAD exchange rates.
FERGUSON PLC – DAILY PRICE CHART – 2018-2023
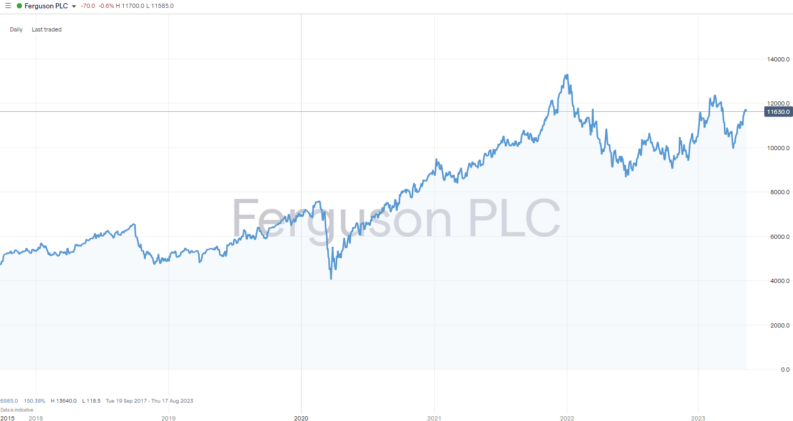
The firm’s status as a top pick isn’t down to currency moves alone. The quarterly earnings report for the business released in January 2023 included stellar sales figures. On a year-on-year basis, revenue was up 4.87%, and the net change in cash was 99.4%
Strong business fundamentals have allowed Ferguson to return cash to investors as dividends, with the stock currently recording a dividend yield of 2.6%.
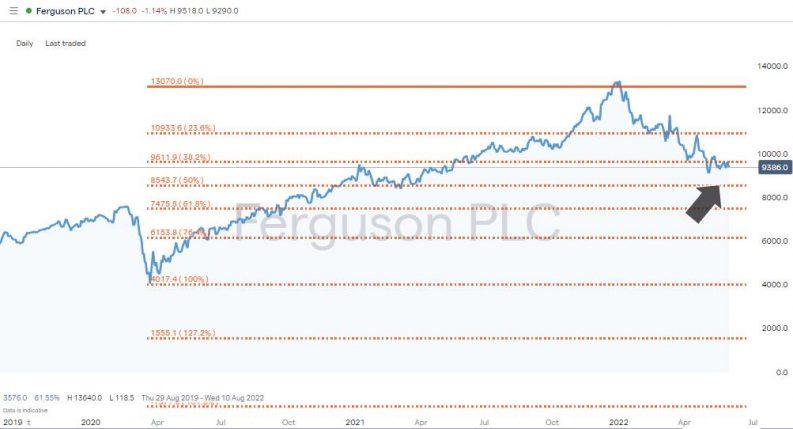
Ferguson PLC has a market cap of £25.17bn, which puts it in a different size bracket from Shell and Rio Tinto. Those huge multinationals have enough critical mass to offer investors security, but as demonstrated by the recent sales figures, Ferguson has more potential to continue expanding its business.
LON: SBRY
Value stocks are an ideal form of investing in a way that protects against inflation. A household name, J Sainsbury PLC, fits the bill not only because it is one of the UK’s largest retailers but also because its P/E ratio is currently 14.01.
J SAINSBURY PLC – DAILY PRICE CHART – 2017-2023
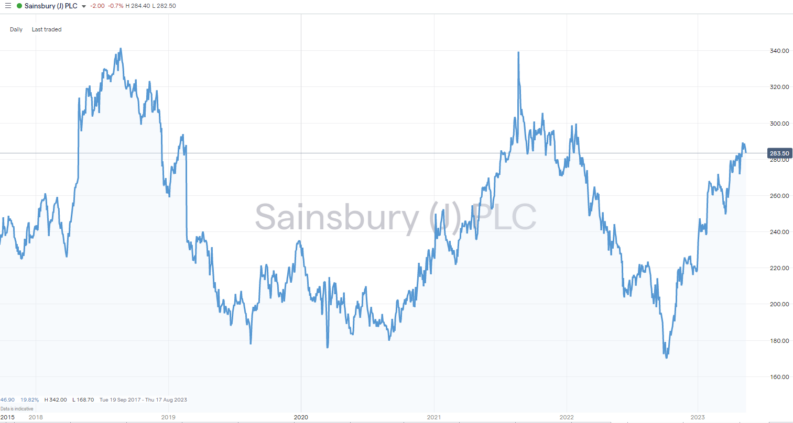
Since late 2022 Sainsbury’s stock price has gained upward momentum because the firm shows signs of avoiding losing market share to discounters. Since 2015, the grocer has managed to grow sales at 4% per year and even posted a 7.44% annual gain between 2021 and 2022. That was partly due to the buyout of Argos and Habitat, which reflects the firm’s willingness to diversify into other business lines.
LON: BARC
Barclays shareholders will be looking up, with new 52 week highs set. The problems that had been facing the economy in relation to inflation, and interest rates do not translate into concerns about the robustness of the financial system.
BARCLAYS BANK PLC – DAILY PRICE CHART – 2017-2023
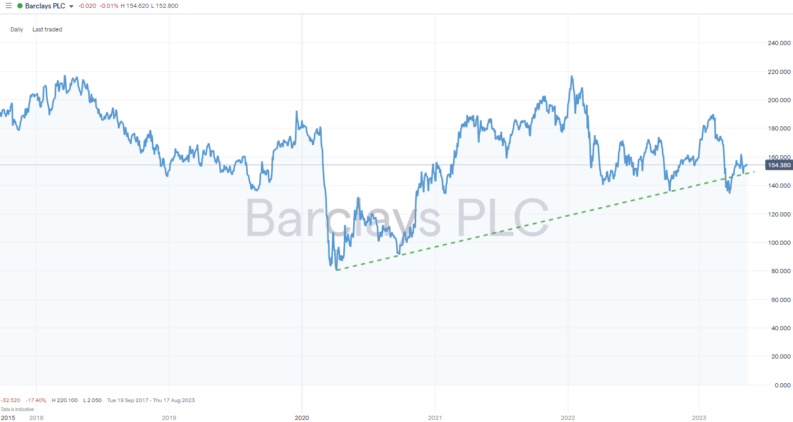
A bounce in the BARC share price would represent capital gains, but while waiting for that, those who buy in at current levels will benefit from a 4.70% dividend yield.
While the long-term supporting trendline holds, there are plenty of reasons to buy Barclays stock to tap into the improved prospects of the banking sector.
Why UK Stocks?
Fundamental analysis throws up several good reasons to buy UK stocks now. Banking, commodity and oil stocks, which make up a large part of the London stock market, are seen as being stocks to buy to beat inflation.
Some of the value shares on the exchange, such as the big UK supermarket stocks, also tend to see demand levels hold up even though price rises are cutting into consumer disposable income.
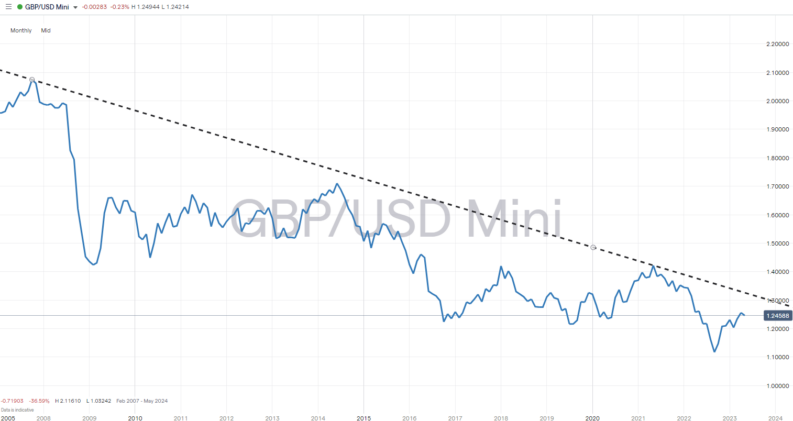
Forex market trends and the unique makeup of some multinationals based in the UK are another attraction. For historical reasons, some bigger UK corporations generate a large percentage of their income overseas. If the pound falls in value, and it’s been in a long-term downward trend since 2007, then the revenue that those companies generate in currencies other than the pound is inflated when passed back to the London headquarters and converted into GBP.
GBPUSD – MONTHLY PRICE CHART – 2007-2023 – LONG-TERM DECLINE
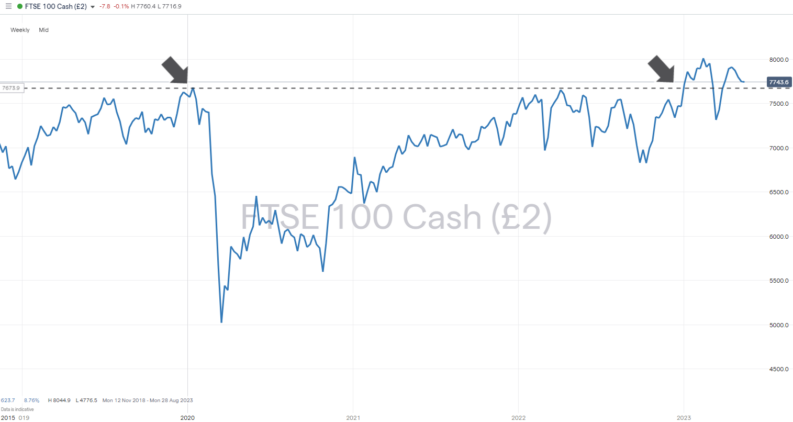
Technical analysis is a third reason UK stocks are considered top picks. The FTSE 100 index has recently broken through a critical long-term resistance level – an all-time high. That high-water mark for the index was 7,799, recorded in May 2018. And the test, and breaking of that psychologically significant price barrier, leaves few technical analysis-based resistance levels in the way of further upward price movement.
Spotting a new trend and trading with it is the secret to successful investing, which means that now is the time to apply breakout-based trading strategies to capture the potential of UK stock investing.
FTSE 100 INDEX – WEEKLY PRICE CHART – 2019-2023 – BREAK OF ALL-TIME HIGH
Not only is the UK stock market one of the most trusted in the world, the high volumes of trading activity mean that commissions are low and bid-offer spreads are tight. That means investors can enjoy cost-effective trading while gaining exposure to an increasingly popular market. The stocks in the FTSE offer exposure to a wide range of sectors, with the best UK stocks to buy now including small and large-cap firms, so there is a target stock for every type of investor.
UK Market Performance
The paradigm shift in investor attitude brought on by rising interest rates has been good news for LSE-listed stocks. However, digging into the details and picking the best-performing stocks in the FTSE opens the door to even greater returns.
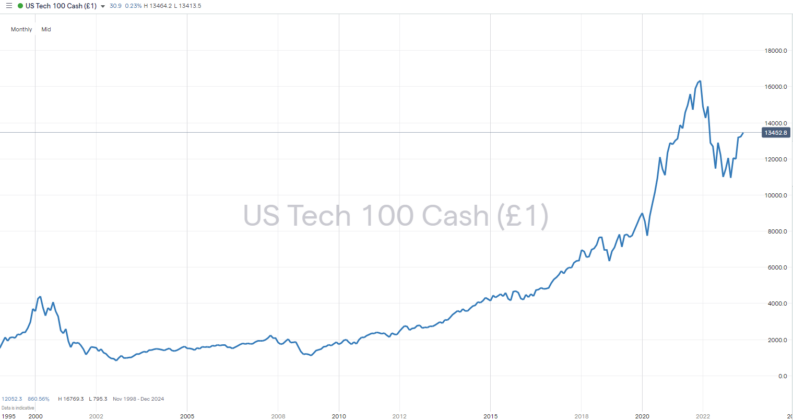
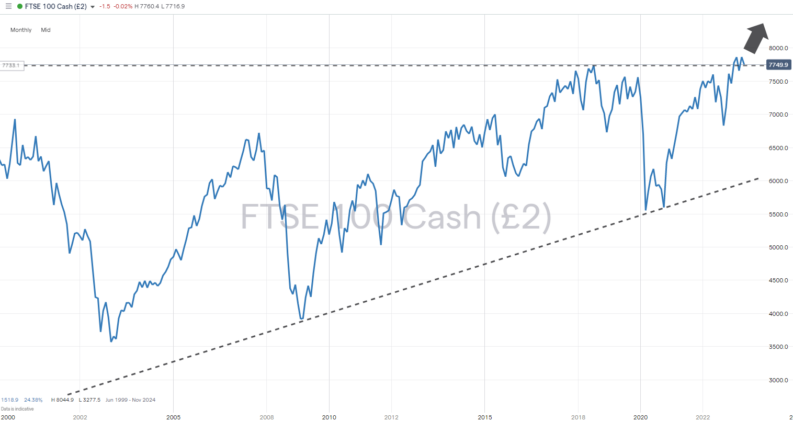
On a long-term timeframe, UK stocks have underperformed most other benchmarks, especially those containing sometimes more glamorous growth stocks. Since the lows of 2009, the FTSE 100 has increased in value by 97%, but the Nasdaq 100 has, over the same time, increased in value by 1104%.
Zoom in to more recent trading history, and there is a sign that the trend has turned. In 2022 the Nasdaq 100 suffered a 33% fall in value while the FTSE 100 held up relatively well, showing an annual gain of 0.9%. The last 12 months have since seen the FTSE 100 add a little over 8%, whilst the Nasdaq composite has gained 30%, and the S&P 500 more than 25%. Volatility swings both ways, amplifying sentiment.
NASDAQ 100 INDEX – MONTHLY PRICE CHART – 2000-2023
FTSE 100 INDEX – MONTHLY PRICE CHART – 2000-2023 – RELATIVE UNDERPERFORMANCE
YOUR CAPITAL IS AT RISK


