Technical analysis (TA) is a popular trading strategy that uses historical market prices to try and predict future price moves. It is used by traders — ranging from beginner traders to multi-billion-dollar hedge funds — for the very simple reason that it can be highly profitable. With this in mind, this article will explore the following:
- What does a beginner need to know about trading using Technical Analysis?
- Which markets can I trade using Technical Analysis?
- What Technical Analysis strategies are worth implementing?
- What can go wrong when using Technical Analysis?
- Paradigm Shift
What does a beginner need to know about trading using Technical Analysis?
No strategy is risk-free and TA, in particular, embraces the principle of accepting losing as well as winning trades. It’s all about shifting the balance of probabilities in your favour to improve your overall trading performance. If your win-loss ratio is 51-49, you’ve made a profit.
Gaining an understanding of the principles of TA opens the door to what is ultimately a relatively straightforward process. It can appear slightly daunting at first as there are many different forms of TA, but millions of traders have put in the time to use it to make a profit from trading.
Three terms dominate the Technical Analysis environment. They are often interpreted in different ways by different traders, so it’s worth beginners starting off with a precise definition.
- Charting— Basing decisions off a sequence of data points (prices) plotted over a specific time-frame.
- Indicators— Mathematical calculations, which are based on price data and then laid over the price chart.
- Oscillators— Uses price data to constructs ‘bands’ between two extreme values, and then build a trend indicator that fluctuates within the bands.
All of the above aim to help traders identify certain signals and trends within the market and trade entry and exit points. They just do it in slightly different ways.
Charting
This is a good way to build an understanding of the principles of TA as it offers a visual image of how to use past price data to predict future moves.
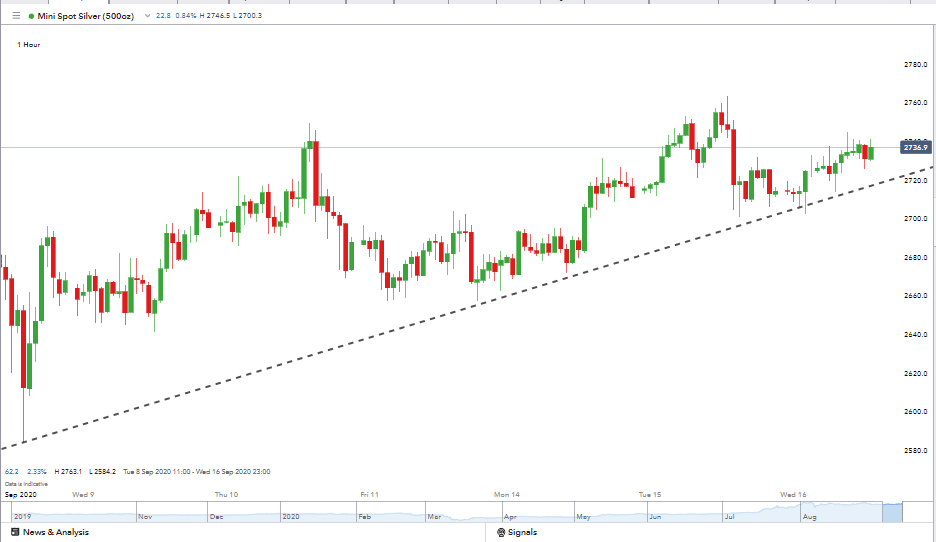
The below price chart in silver shows how a supporting trend line can be used. The theory is that until the trend-line is broken, price will continue to rise.
Silver price chart — hourly (1H) candles:

Source: IG
Indicators and Oscillators
These two-run hand in hand. Visit any top-tier online broker and you’ll find an abundance of them.
The following trend indicators are available at the MetaTrader trading platform.
- Adaptive Moving Average
- Average Directional Movement Index
- Average Directional Movement Index Wilder
- Bollinger Bands®
- Double Exponential Moving Average
- Fractal Adaptive Moving Average
- Ichimoku Kinko Hyo
- Moving Average
- Parabolic SAR
- Standard Deviation
- Triple Exponential Moving Average
- Variable Index Dynamic Average
The following oscillators are also available at MetaTrader:
- Average True Range
- Bears Power
- Bulls Power
- Chaikin Oscillator
- Commodity Channel Index
- DeMarker
- Force Index
- Momentum
- Moving Average of Oscillator
- Relative Strength Index
- Relative Vigor Index
- Stochastic Oscillator
- Triple Exponential Average
- Williams' Percent Range
It’s highly likely that you’ll find you develop a personal preference, but be sure to practise in a demo account while you do that research. The trick is knowing which metrics to apply to which situation.
Which markets can I trade using Technical Analysis?
Technical analysis can be applied to any asset type that has sufficient liquidity (trading activity) to provide enough data points.
Some assets rarely trade and so provide little clue in terms of market sentiment, moving averages or trend lines. On the other hand, the forex, stock indices and global commodity markets are happy hunting grounds for TA traders.
Trading volumes in the global forex market can be as high as $6.6tn per day, according to the Bank for International Settlements. The liquidity provides traders with a mountain of historical data to analyse. It also means that individual actions are less likely to distort price. The market is just too big for any individual party to manipulate it.
What Technical Analysis strategies are worth implementing?
One of the most interesting aspects of TA is that the time-frame used can be critically important.
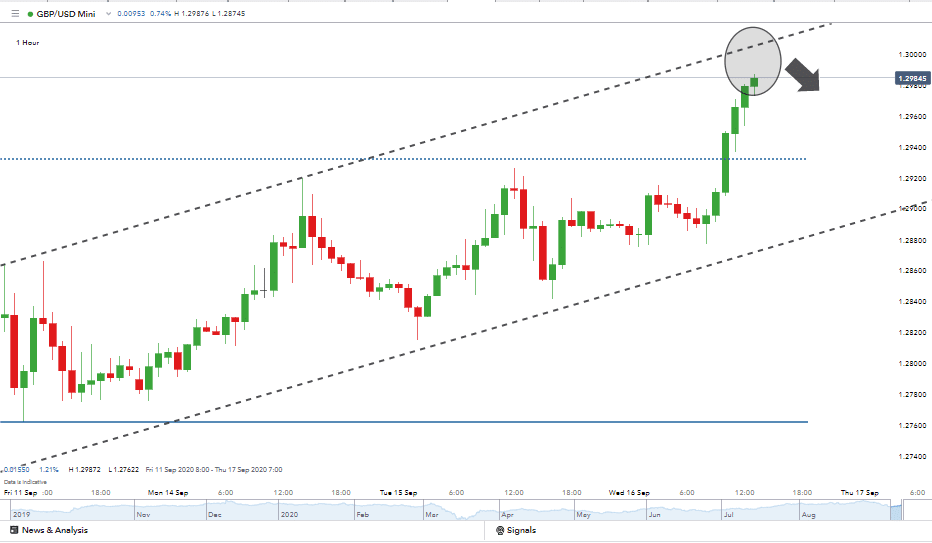
A buy signal on an hourly chart can be at a level that is indicating a sell signal on a daily chart.
The hourly (1H) candlestick chart for GBPUSD below shows price nearing the top of the resistance line in an upward trend channel.
GBPUSD price chart – hourly (1H) candles:

Source: IG
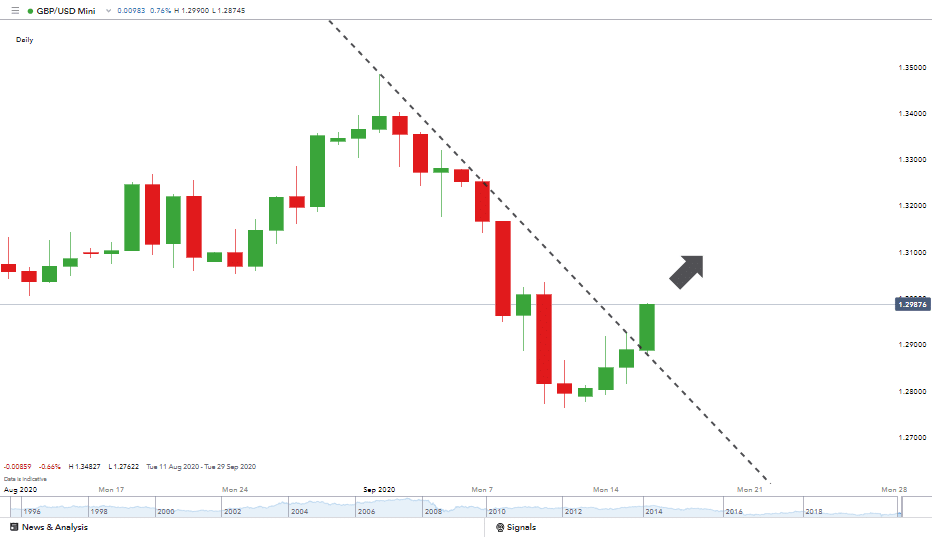
The longer-term price action in the above chart is throwing up ‘buy’ signals in the same currency pair. The trend-line break is a textbook buy signal. Every trend has a bend at its end and, in this case, the two-week price fall in GBP GBPUSD appears to have just come to a turning point.
GBPUSD price chart — daily (1D) candles:

Source: IG
This contradiction can, however, be explained away. Both signals can be treated as valid. If your preference is for short term investing, then the 1H sell signal could be for you and generate a profit.
With the longer-term trend in mind, you might not want to hold that position for too long.
If you’re looking to put a position on, which might come good over a period of days or weeks, then the daily candle chart ‘buy’ signal might be the one you give most time to achieve this.
Strategies that use TA can be broadly graded in terms of time-frame. Scalping for example, involves trading a large number of trades over a short time frame:
- Scalping– Making small profits on a large number of trades. This involves opening and closing multiple positions throughout the day.
- Crowd Trading— Putting positions on that take advantage of the moment price moves through well-known stop loss levels.
- Day Trading— Intraday trading where all positions are traded out of before the market closes.
- Range Trading— Trading the extreme ends of the price channel, selling at the top and buying at the bottom.
- Trend Following— Typically associated with longer holding periods. Observing ‘higher-highs and higher lows’ and trying to hold the position as long as possible.
Of course, Range Trading and Trend strategies can be applied to any time frame — a one-minute trend is still a trend. It’s just that the phrase is most often associated with lower frequency trade activity.
One notable factor is that the signals used in the different strategies can become self-fulfilling. If the majority of traders are watching a price move above a particular level before they buy then when it does, there is considerable momentum to support the move.
What can go wrong when using Technical Analysis?
The passion that TA proponents show for using price data to trade the markets suggests that, for many, it’s a profitable strategy. Knowing why it doesn’t work for others, or more importantly at certain times, explains why no approach can be considered fail-safe.
In a perfect world, traders would be able to develop and implement strategies and give up their day jobs. One of the biggest challenges to TA is, ironically, the fundamental analysis it so willingly discounts.
Remember, in its purest form TA bases decisions solely on the price charts of an asset and discounts features of fundamental analysis. But what happens when fundamental analysis gate-crashes the party?
This is best explained by shock news events. Even the most ardent TA trader will accept that market shocks can smash holes in the profit and loss balance.
Events that can de-rail TA include:
- Unknown news events
- Surprise outcomes of known news events
- Natural disasters
- Social/political unrest
Surprise news events are, by their nature, random. Taking this further, periods in time when shock events are more likely to happen challenge the effectiveness of TA.
Freak-weather events or military conflict in the Gulf can shift the markets in a matter of moments. The global coronavirus pandemic caused an initial reaction, but some of the after-shocks relating to vaccine-news or outbreaks of infection are still coming through.
The outcome of the Brexit referendum in the UK and the election of Donald Trump as President of the United States both shocked established commentators and analysts. These events had known announcement times, but a surprise outcome can still distort the markets.
Paradigm shift
What gives advocates of technical analysis restless nights is ‘paradigm shift’. Put simply, this is when elements that have generated a profit for a long time just stop working.
This is particularly troublesome for TA analysts as their models work on ‘accepting’ losses as part of the equation. If a strategy suffers 10 losing trades in a row, that is an accepted part of the modelling, a statistical outlier or a sign that the game is up.
At this point, discretionary and emotional factors come into play. Cut the strategy too soon, and you might not benefit from the 10 winning trades to follow. Cut it too late, and you might blow up your account.
The Bottom line
Millions of traders make a profit by applying strategies that are based on technical analysis.
At the same time, others use TA and make losses. This can be because the TA is applied inappropriately — the market may be trending, so scalping strategies are ineffective.
Another factor is that because the TA trade entry points are well known, situations can develop where everybody is receiving the same signal. This can be profitable, at least for a time, but if the trade gets too ‘crowded’, it can be counterproductive.
This highlights that a degree of discretion is often applied, which goes against the methodology being purely based on market data.
The reality is that TA is widely used and most commonly included as part of a broader approach. Traders who base their decisions on fundamental analysis may still use TA to choose the optimal entry point into a particular position.


