The Commodity Channel Index or CCI was developed by Donald Lambert in 1980. The indicator is a momentum-based one, and like many other indicators, it helps to tell the user when the asset is in a bullish or bearish trend.
It can also be used to judge the direction of a trend, help traders to make decisions on the directional bias of an asset, or provide information on whether to exit a trade.
In this article, we will take you through what it is, how to use it, and the advantages and disadvantages of doing so…
What is the Commodity Channel Index?
The index itself measures the current price against the average price over a specified period.
So, for example, when the current price is high compared to its average price over the period, then the CCI will move higher. The same applies if prices are lower than the average over that period, the CCI will move lower.

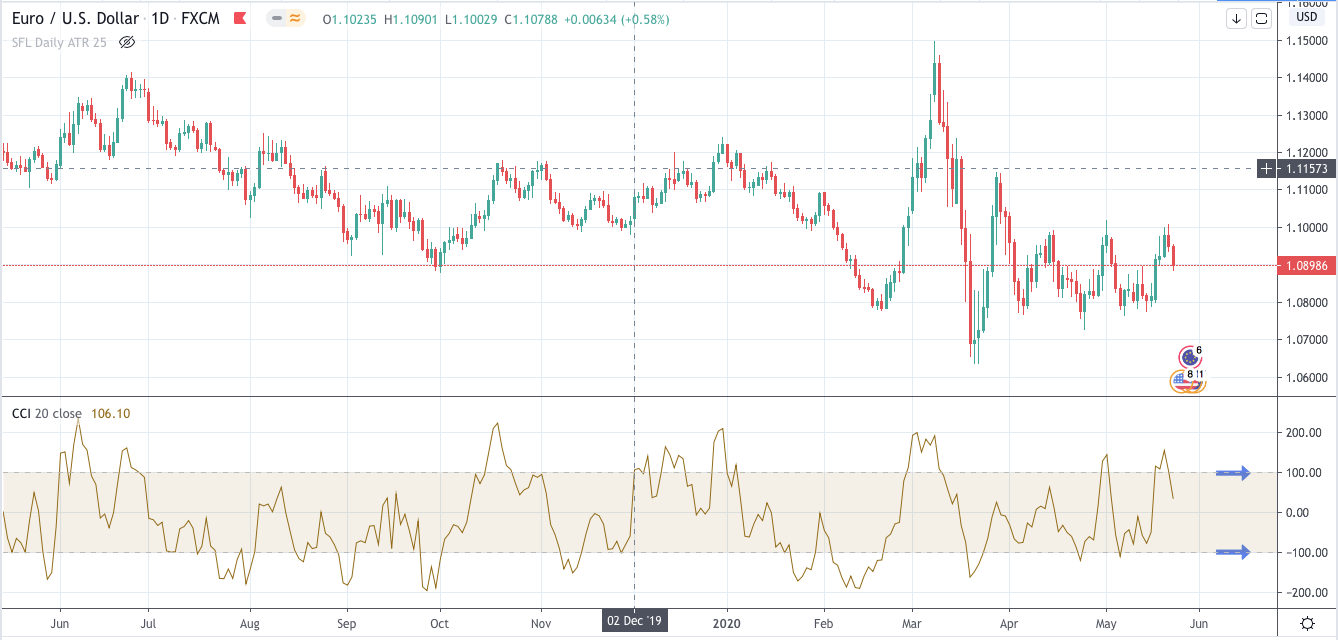
As you can see in the picture above, there are levels set at the +100 mark and -100 mark on the indicator. If the CCI moves above the +100 level, it indicates that price is now in an emerging bullish trend, and if price falls below the -100 level, it suggests that price is in an emerging bearish trend.
There are no upside or downside limits on the indicator, so determining overbought and oversold levels is objective and will require your own research depending on the asset you are trading.
The final point to note is that the number of periods used to calculate the average can be adjusted depending on your preference and research.
How can you use it?
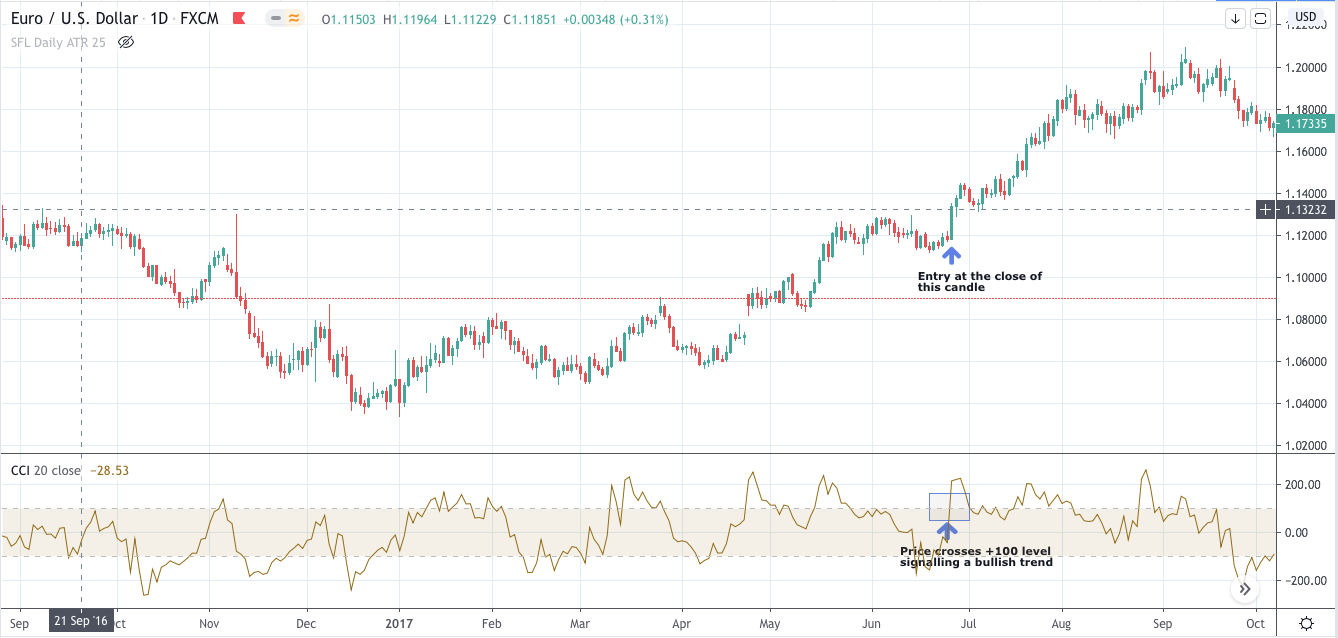
So, let's say we are trading the EURUSD pair as you can see in the picture below…
We have the indicator set-up on our chart, and we are using the standard period of 20.

As we know, we can use the indicator to determine price trends. So if you take a look at the picture above, you can see the highlighted point where price has crossed the +100 level on the Commodity Channel Index signalling a potential opportunity to put in a buy order.
You could then choose to exit the trade when you feel that price has turned against you, the CCI has hit a level where you believe it is overbought, or when price turns around and crosses the -100 level, signalling a downtrend.

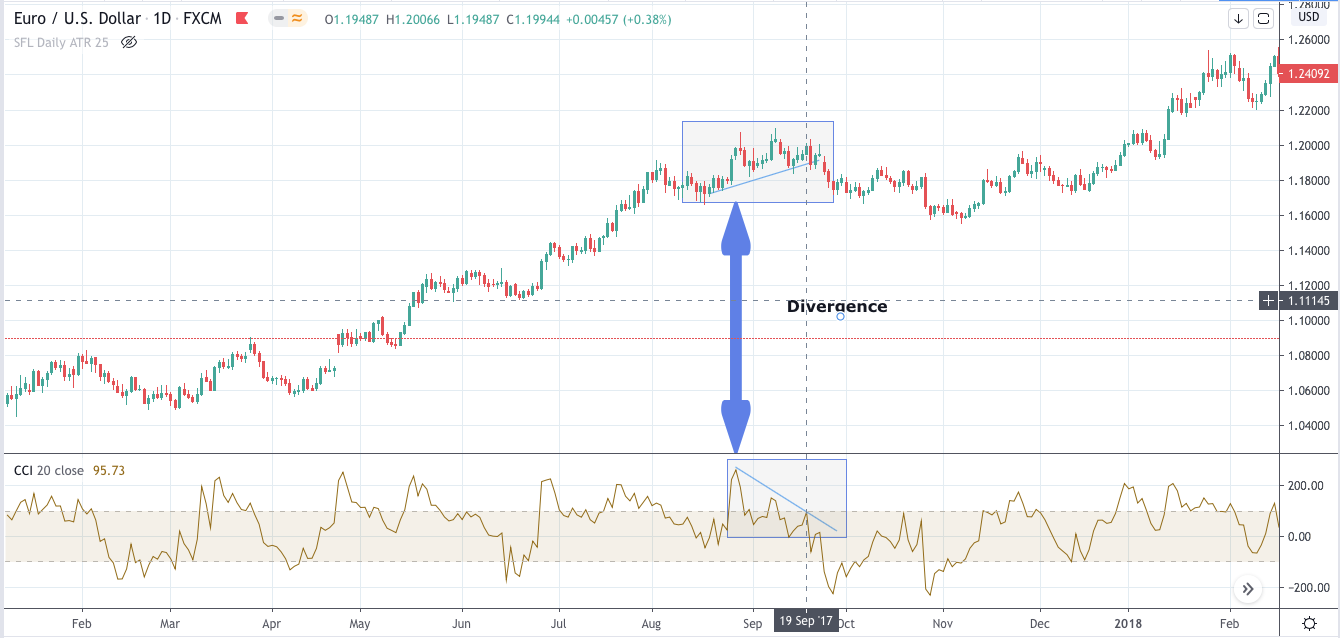
You could also use the CCI to show divergences. This is when the price will move one way, but the indicator will move the other. This could show weaknesses in a trend. An example of divergence can be seen in the picture below.
Advantages
As you have probably already noticed, there are a couple of advantages to using the indicator…
To start, it will help you in identifying when a new trend is emerging. Trying to catch the beginning of a move can be extremely difficult, and a tool to help with that is definitely considered a useful one.
You can also use it to identify weak or a weakening trend using divergence. This can help minimise losses by providing a reason to exit a position if you see the price move weakening.
Disadvantages
Of course, there is a downside to a lot of technical indicators, and the CCI is no different.
When it comes to identifying whether the price is overbought or oversold, the CCI is subjective and previous levels where price may have turned around will have no bearing on future moves, although you may be able to recognise patterns over a specific period.
It is also a lagging indicator, and so, it will sometimes provide poor signals as it lags behind price. For example, the CCI moves above the +100 level may be too late as the move may have already run its course.
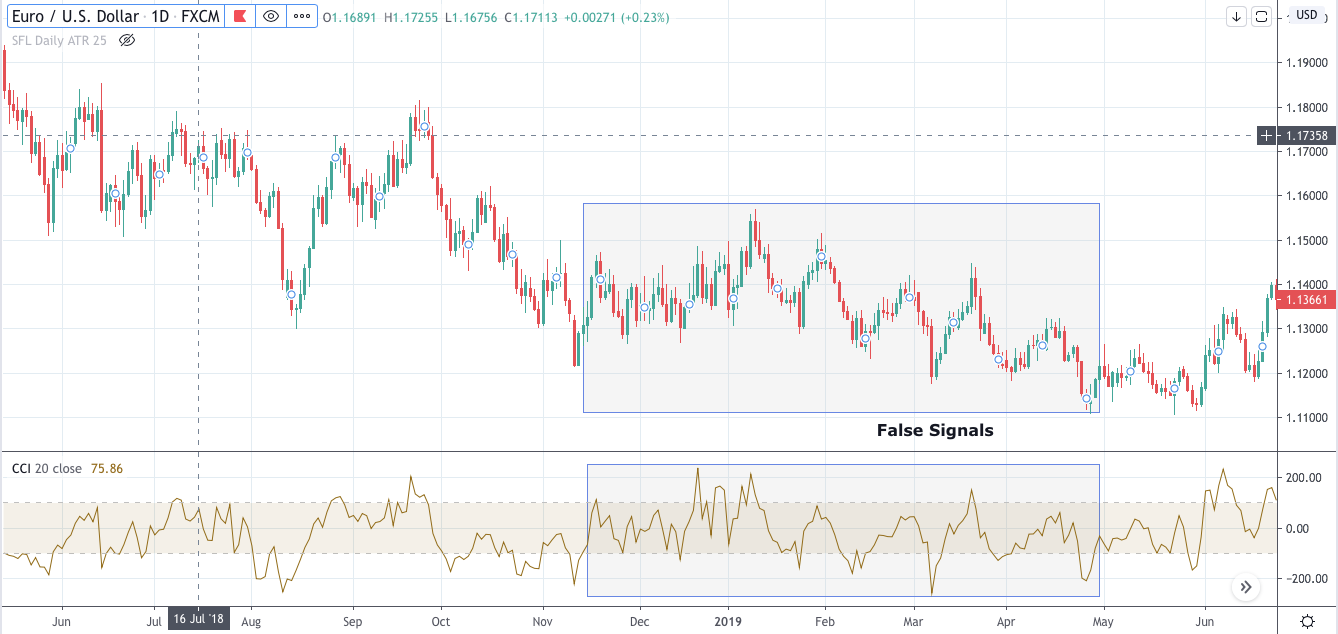
Finally, there is the potential for many false signals. If the asset is volatile and prone to big swings in its price, then this could cause the CCI to provide many potential signals within a short timeframe…
And in combination with it being a lagging indicator, it can cause consecutive losses.

Conclusion
In conclusion, we do feel that the indicator can be a useful tool if used correctly.
However, to use it on its own would be extremely challenging and so we would suggest using it in conjunction with another form of analysis to really make the most out of it and prevent the potential for consecutive losses.
PEOPLE WHO READ THIS ALSO VIEWED:


