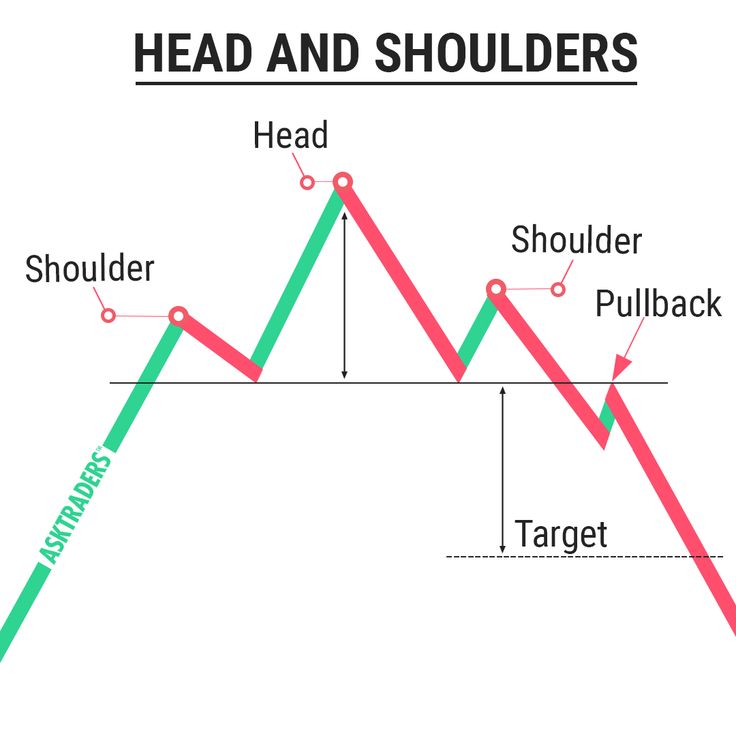
One of these chart-reading trading strategies is called the “head and shoulders” pattern. It is a widely used pattern that is commonly known as “shampoo” after the well-known shampoo brand. This pattern consists of three notable peaks: a high peak in the centre of the pattern and two double peaks placed on either side of the high peak. This pattern forms something similar to a silhouette of a head (the high peak) and two shoulders (the double peaks), which is where the name originated.
Trading with the head and shoulders pattern
A break in the “neckline” of this pattern indicates a relevant opportunity. If the neckline is broken, it can be wise to open a short position opposite the pattern indicator. This trade can be entered immediately, or traders can pull back and test the position. This latter method is popular because it proves more security and shows that it is not a misleading pattern change.
Many example charts will make it simple and straightforward to spot the head and shoulders pattern. However, the real market trends are not always as easy to read. What is especially crucial is that these patterns need to be spotted immediately as they happen, or they will become outdated and worthless to real-time trades.
The neckline (which is often also called the bottom line) is a type of support level. It can be challenging to spot at times because it is often a descending or ascending line rather than a straight one. The fact that the neckline may slope adds to the difficulty of spotting it. Therefore, traders should focus on the chart as a whole rather than the neckline alone. A more inexperienced trader might want to switch to a line chart rather than a candle chart.

Recognizing head and shoulder patterns
The first step to recognizing a head and shoulder pattern is looking for the aforementioned peaks with a penetrated neckline indicating its usefulness. Unfortunately, as with all techniques that help traders learn CFDs, commodities, stocks and all other markets, these require more than just the ability to spot a pattern. One factor that always reveals relevant indications is volume. Although it does not always occur this way, the volume should decline with each peak. As the volume lowers on the high peak (the head), it can indicate a price decline.
The profit and risk-to-reward ratio can be increased if an overbought pair is recognized when the volume is low at the top of the third peak (second shoulder). Formations like dojis, pins or inverted hammers on the candlestick chart will then make way for a trade to be placed. Along with a stop on top of the high peak, the higher profit and ratio can be achieved.
Inverse head and shoulders pattern
A pattern shaped like an upside-down head and shoulders is called an inverse head and shoulders. This means that the same concepts will apply, but they will be reversed to suit the inverse pattern. Since the neckline was a support level with the normal head and shoulders, the neckline will be a resistance level for the inverse of this pattern. As with the normal neckline, it may be ascending or descending rather than a straight line.
The head and shoulders pattern serves the purpose of allowing traders to better understand a chart. By being able to analyse these patterns correctly, traders can make highly profitable trades and reduce the risk of losses.


