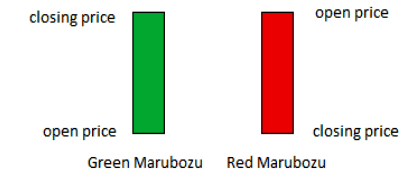
Marubozu candlestick patterns indicate a period of market activity that is strongly decisive and suggests continued movement in the direction of the candle’s closing price. These Japanese candlestick patterns become visible as long, solid candles without upper/lower shadows.
When the Marubozu is bearish, closing prices are below the opening prices for the period and this offers a signal for traders to establish short positions. Conversely, when the Marubozu is bullish, closing prices are above opening prices and this offers a trading signal for new long positions.

Marubozu patterns can provide trading signals for assets in all classes (such as commodities, foreign exchange, cryptocurrencies, or stocks), so they are highly diverse in a broad range of trading applications. To identify Marobuzu candlestick formations, consider the following characteristics as essential:
- Single-candle formation has a long real candle body.
- No candle wick (or very little candlewick visibility on the trading charts).
- Continuation price candles agree with the trend direction implied by the Marubozu pattern (bullish or bearish).
Marubozu trading signals can appear anywhere on a price chart, but they tend to be most powerful when they follow a period of sideways trading activity. This suggests that the market has found a catalyst after a period of indecisiveness and this raises the chances that the market will follow through with continued trend movement in the same direction.
Chart Example: The Marubozu Candlestick Pattern
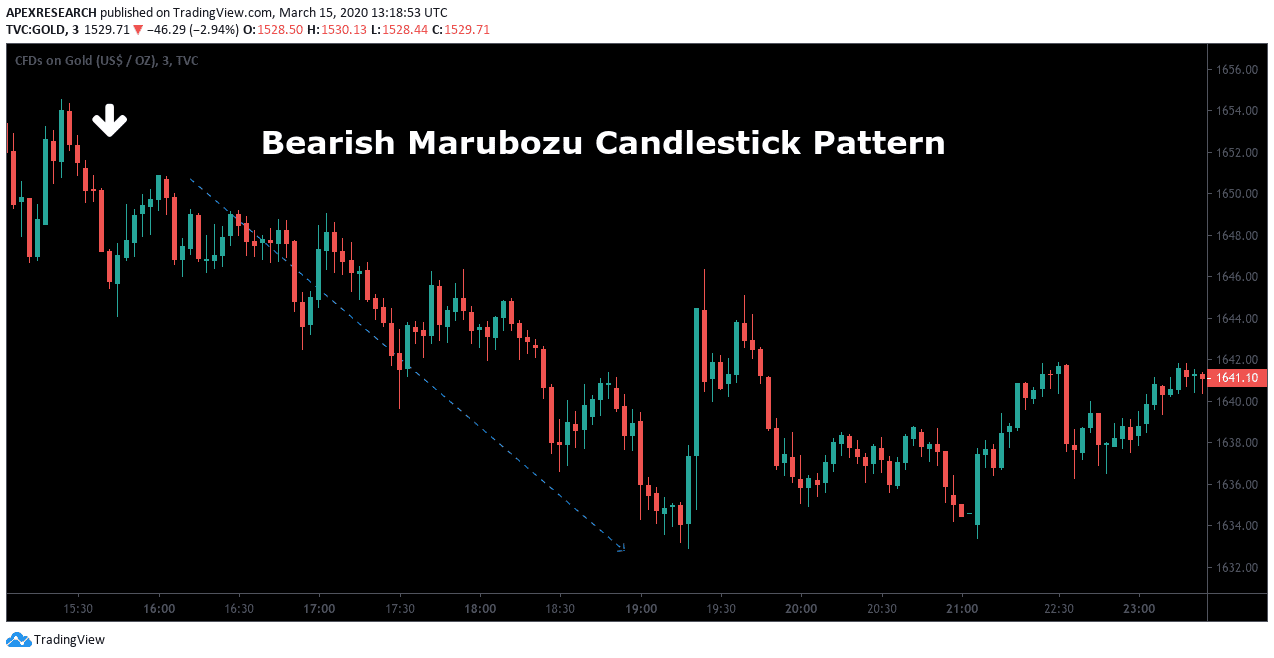
In the chart example below, market prices are trading at elevated levels before a long, solid bearish candle closes at its lows. This suggests that the prior rally has come to an end, and bearish traders can establish short trades to capitalize on a potential downtrend move. As we can see, valuations quickly head lower and one of the first technical analysis signals that became visible was the bearish Marubozu candlestick pattern near the left side of the price chart. In this case, stop-loss orders could have been placed above the opening price of the Marubozu price pattern and traders could have avoided drawdown before the value of the asset plummeted.

Using this strategy, bearish traders would be able to benefit from declines in price through short positions and trailing stop-loss orders. However, similar approaches can just as easily be established in long positions whenever the proper criteria are met for the development of this candlestick trading pattern. Overall, Marubozu price patterns offer an excellent technical analysis tool that can be used by traders of any experience level but candlestick analysis concepts are highly complex interpretations of changes in market sentiment that could never be visible on a simple line chart.
Marubozu Candles
- Marubozu candlestick patterns indicate a period of market activity that is strongly decisive.
- Developments in these patterns suggest continued movement in the direction of the candle’s closing price.
- These Japanese candlestick patterns become visible as long, solid candles without upper/lower shadows (or with a very small shadow). When the Marubozu is bearish, closing prices are below the opening prices for the period and this offers a signal for traders to establish short positions. Conversely, when the Marubozu is bullish, closing prices are above opening prices and this offers a trading signal for new long positions.
- Marubozu price patterns offer an excellent technical analysis tool that can be used by traders of all experience levels and protective stop-losses should always be implemented whenever you are trading live positons.


