Consisting of three candlesticks, Morning Star candlestick patterns generate bullish trading signals that can be used when establishing long positions in financial markets.
They are used by technical chart analysts as a signal to identify bullish reversals after a downward-trending price period. Traders are able to confirm the formation of a Morning Star pattern using indicator reading that might suggest that asset prices have become oversold.
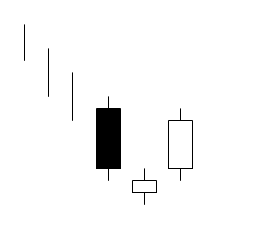
- Morning Star patterns are composed of one long bearish candlestick, one short-bodied candlestick with two long wicks, and one long bullish candle to complete the reversal.
- The second candle in the pattern is called the Morning Star Doji and it indicates a period of indecision in the market because there are not enough bearish traders left to drive prices lower.
- The third candle in the pattern signals the beginning of an uptrend and the Morning Star reversal is established when prices move above the highs recorded in the first bullish candle period.
How is a Morning Star candlestick formation useful for traders? A Morning Star pattern does not require difficult calculations and it allows traders to spot bullish trend reversals in their early stages.
A Morning Star pattern will often near an important support level because these are areas of the market that have attracted buying activity in the past. Additionally, traders can use other technical indicators (such as the Relative Strength Index) as an outside confirmation that might be considered more objective in nature.

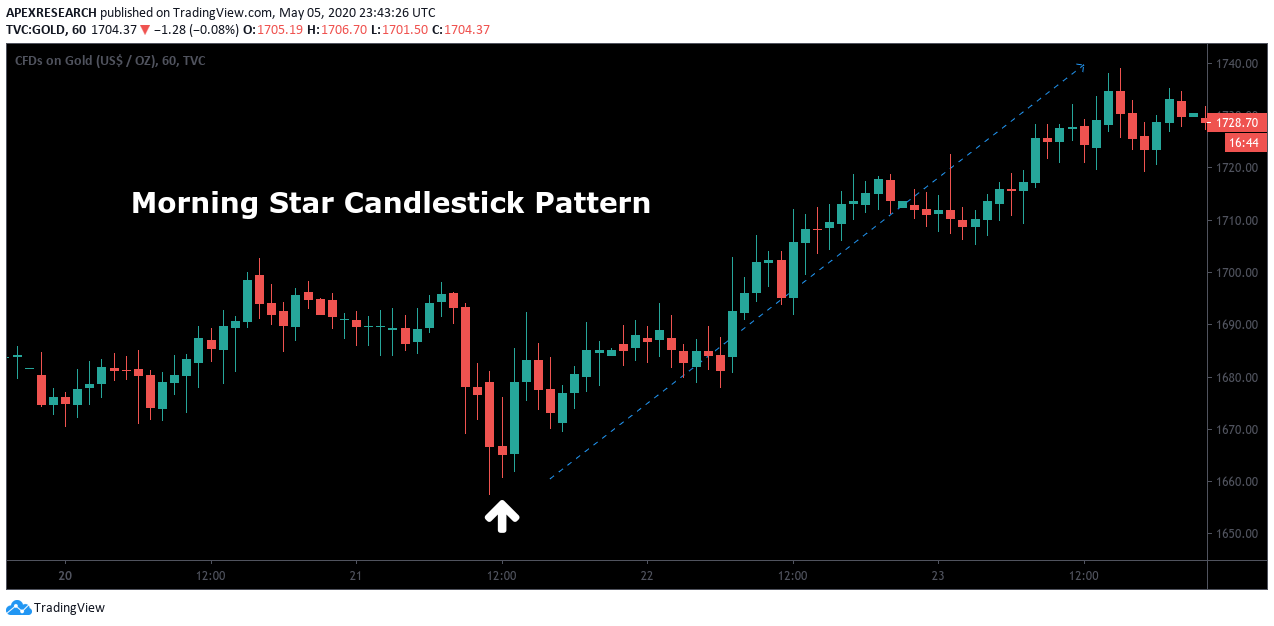
The chart graphic shown above has given a model of how the Morning Star trading approach begins. The most important aspect of the formation is the middle Morning Star candle because it indicates a period of indecision required for a reversal. Using live charts, we can see how the Morning Star formation can often signal major rallies in the underlying price of an asset.

In this example, Morning Star trading strategies could have been based on the market’s low price valuations (coming after a downtrend). As a result, we can see that Morning Star candlestick formations are a great way to buy low before selling high.
When trading in stock markets, these signals might also be influenced by the volume levels that accompany the event. In most cases, a stock trader waits to see rising volume as another way of confirming the potential for a true reversal in the market.
Under these scenarios, the most important price candle in the Morning Star formation is the final bullish candle because this would indicate that more traders are moving in the upward direction. Once this occurs, prices are often able to gain enough momentum to break above the highs that were recorded during the first candle in the pattern.
Value investors or traders that are looking to “buy the dip” can benefit from these events when long trades are initiated. Morning Star patterns often include a Doji candlestick pattern in the second position, which should not be surprising because this is an indicator of market indecision.
For these reasons, aggressive traders might begin thinking about establishing new long positions in anticipation of an upside reversal. Of course, trading based on Morning Star patterns alone might not be the best way of achieving a comprehensive trading strategy. This is why expert traders will often combine these signals with technical indicators and market value readings before entering into live positions in the market.
PEOPLE WHO READ THIS ALSO VIEWED:


