The V-bottom pattern derives its name from the V shape formation that appears when price momentum switches from an aggressive selling to an aggressive buying state.
YOUR CAPITAL IS AT RISK

Table of contents
What is the V-Bottom Pattern?
This chart pattern is a powerful bullish reversal pattern and appears in all markets and time-frames but due to the nature of the aggressive buying that takes place when a market reverses direction, it can be difficult to identify this pattern in real-time.
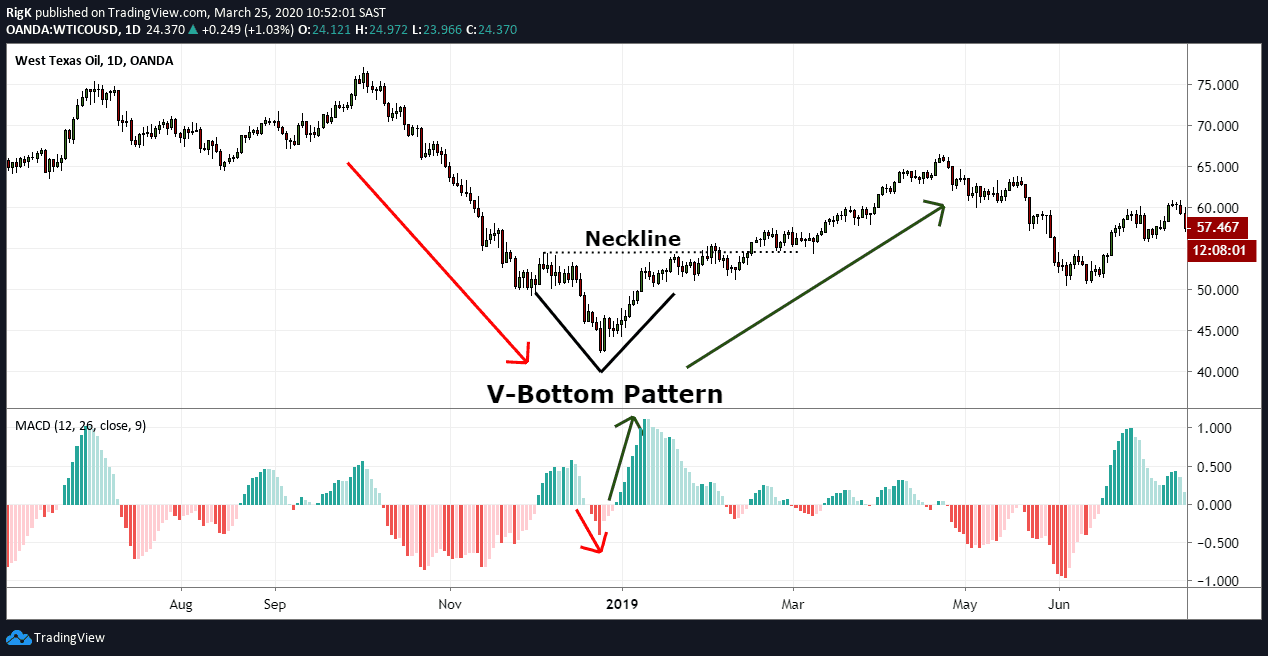
The chart above shows a picture-perfect V-bottom at the end of a bearish trend in Crude Oil. Price traded lower into a bottom and immediately reversed higher with a massive increase in momentum. It is nearly impossible to predict V-bottoms, but most traders will wait for price to break the neckline of the pattern and then enter a long position once price retests the neckline.
Traders Tip: Early indications that a V-bottom is taking place would be the presence of a 1-3 bar reversal accompanied by an increase in momentum and volume during the downswing that forms the low and the immediate upswing that follows.
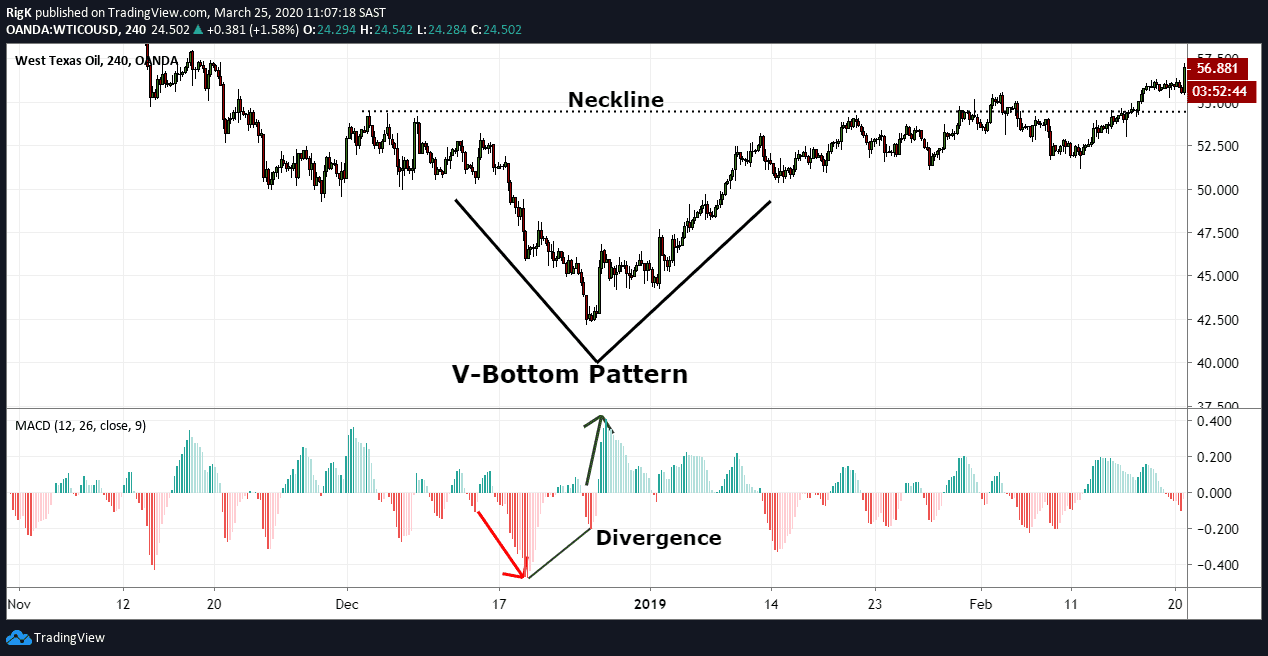
Here is the same V-bottom pattern in Crude Oil but shown on a 4-hour chart. Note that although momentum spiked lower at that low, that there was momentum divergence present between the MACD-Histogram’s lows before price reversed higher with a dramatic increase in momentum.
Although this does not happen all the time, it can be another indication that confirms a V-bottom is forming, especially when you start seeing an increase in buying pressure afterward. Observing the price action by using different time-frames can, therefore, be very helpful when you suspect a V-bottom is underway.
YOUR CAPITAL IS AT RISK
How to Trade the V-bottom
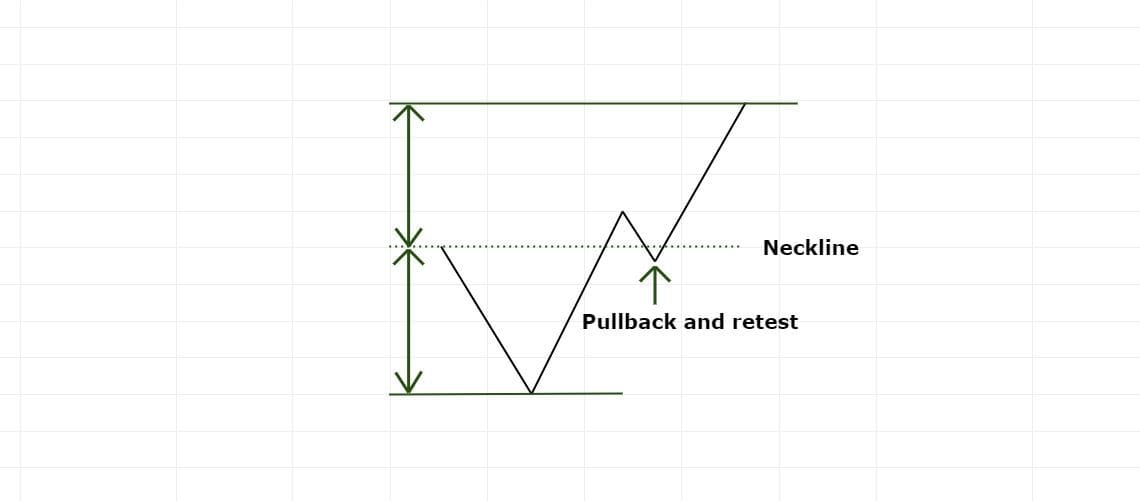
A conservative way to trade the V-bottom would be to wait for a break and close above the neckline and to attempt a long position once price pulls back to the neckline and gets rejected.
An ideal target can typically be set above the neckline, equal to the distance measured from the low of the pattern to the neckline high.
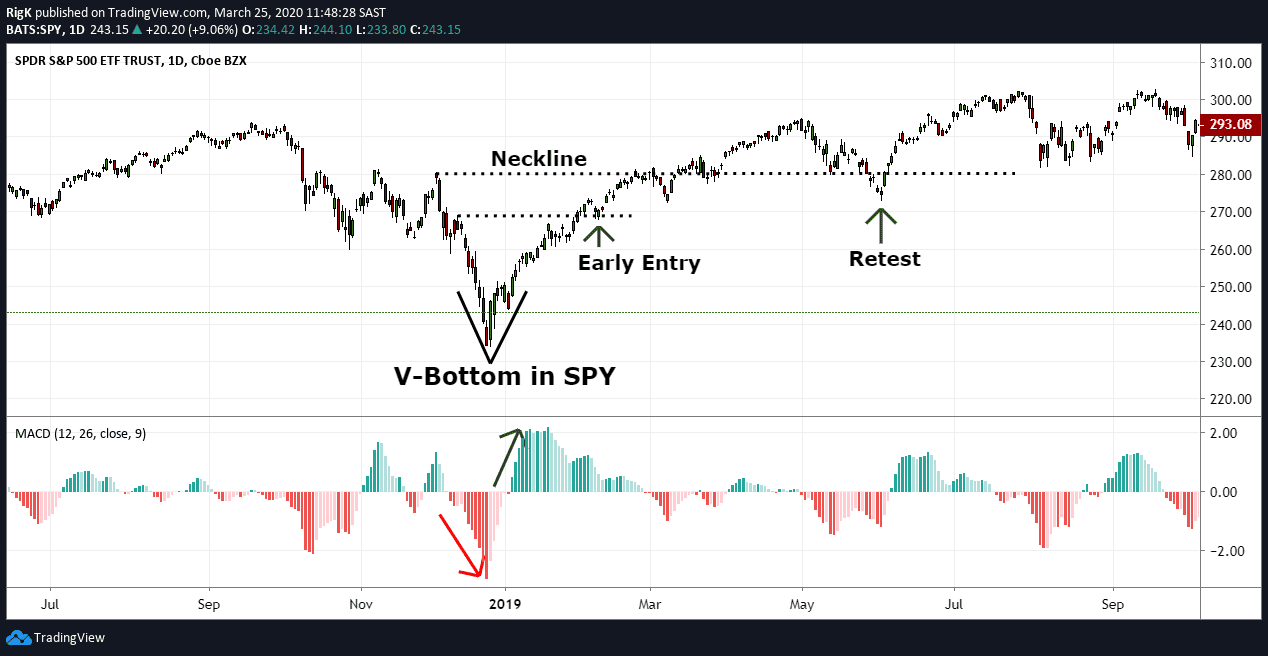
The final chart above shows a great example of a V-bottom pattern in SPY (S&P 500 ETF) that ended the decline that took place during 2018. Price dropped into a low with a lot of momentum but suddenly reversed with momentum increasing on the way higher.
There could have been confusion as to where the neckline should have been placed but advanced traders who have spotted this V-bottom reversal early enough may have attempted long positions using any swing that was formed during the previous selling phase.
As we all know by now, SPY entered another strong bullish phase after that V-bottom and traded higher for the remainder of 2019.
Trading V-bottoms can be difficult because you will more than likely only recognize this pattern once price breaks above the neckline but if you keep a close eye on momentum and even volume, then they can be early indications that a V-bottom is underway.
YOUR CAPITAL IS AT RISK
PEOPLE WHO READ THIS ALSO VIEWED:


