Over time, the triple screen trading system has become a reliable trading strategy that helps traders to reduce the risk of losses. In this guide, you'll learn:
- What the Triple Screen Trading System is
- How it works
- How to properly set it up
- What indicators are used & why
What is the Triple Screen Trading system?
The theory behind this system is that a single indicator cannot predict and analyze market conditions on its own, so it uses more than one indicator. Elder saw that certain indicators work better in an uptrend and vice versa. For instance, trend-following indicators tend to struggle in ranging markets.
The triple screen trading system utilises multiple technical indicators as a tool to eliminate contradictory trading signals. A trade setup that passes all three tests has the best chance to end up being a success.
Elder asked – what if your chosen indicator is fundamentally flawed? Therefore, he designed a system that combines multiple technical indicators. In over three decades, this system has become a reliable trading strategy that helps traders to reduce the risk of losses.
How does it work?
The triple screen trading system conducts three tests on each trade to determine the profit potential of the trade and avoid following contradictory signals. A trade idea should ideally pass all three tests before being tested in live markets.
There are three main trend lengths that should be used:
- The ‘Tide': The long-term trend
- The ‘Wave': The intermediate trend
- The ‘Ripple': The short-term trend
The intermediate (‘Wave') trend length is the most common for this purpose, and it would be found on a daily chart. This should be the one on which your trading idea is based. For instance, if you are aiming to trade on a daily chart, a long-term trend would then be found on a weekly chart, while a short-term trend could be found on a 4-hour chart.
Setting Up The Triple Screen Trading System
As the name itself says, there are three screens applied to each trade:
1. First Screen
The first screen uses an indicator that is one order of magnitude greater than your chosen time frame, it allows you to analyze a broader view of the trends. There are several possible indicators you can use for this, such as the MACD indicator.
Once the direction of the long-term trend has been determined, you will have your trading direction for the intermediate chart, either to buy in the uptrend or sell in the downtrend. Hence, the first screen is the long-term chart.
2. Second Screen
The second screen is used to find a wave heading in the opposite direction from that of the tide in order to find an entry position. For example, if you had a daily chart for your intermediate time frame and the weekly chart shows an uptrend, you would be searching for a decline in the market.
3. Third Screen
When both the first and second screens have been confirmed, a trailing stop will be used for the third screen to carefully locate the entry point. A trailing buy-stop would be placed one tick above the previous day’s high point when placing a long position on a daily chart.
Alternatively, a short position would require a trailing stop-sell to be placed one tick below the previous day’s low point. You can continue trading until the weekly trend moves in the opposite direction or until the trade is activated.
Indicators Used In The Triple Screen Trading System
The triple screen system combines the use of trend-following indicators with oscillators to cover all bases of technical analysis. This is because trend-following indicators work best during trending markets and perform poorly during range-bound markets, while the opposite applies to oscillators.

In agreement with the Dow theory, this method focuses largely on the times used, as each time will have different results. More experienced traders who spent a lot of time analyzing the triple screen system recommend following oscillators:
- Force Index
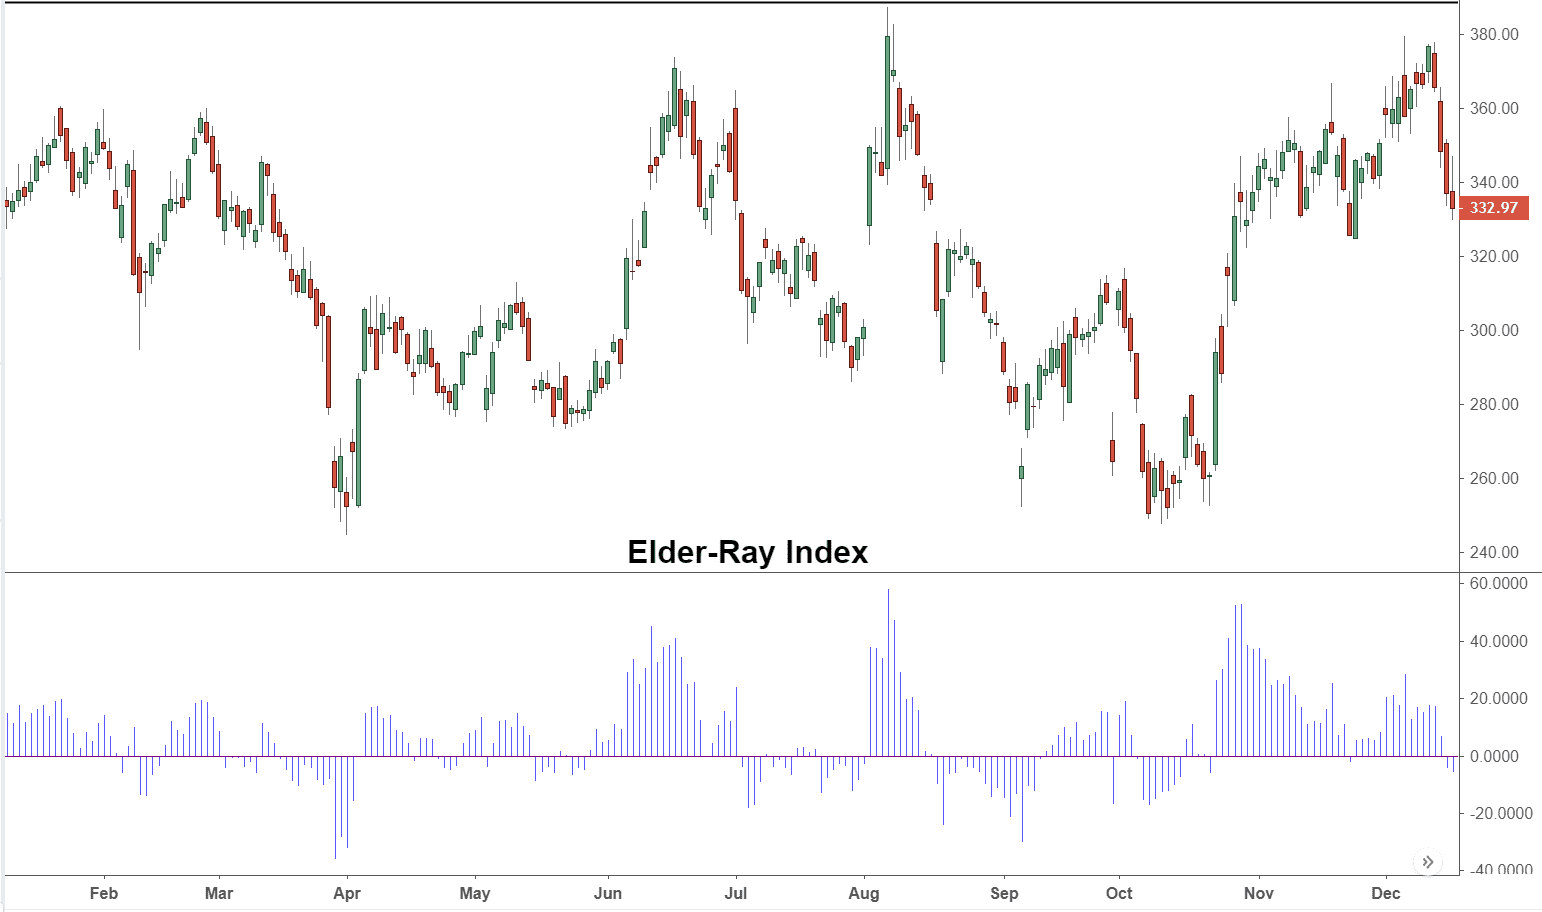
- Elder-ray
- Stochastic
- Williams Percent Range
When to buy
The direction of trade is actually identified by the first screen. When it identifies the direction of the tide, this is the only direction you are expected to follow in the second chart. Therefore, if your trend indicator signals that the price action is trading in an uptrend, you can only open a long position.
The second screen – the wave – is used for an entry position. If the tide points towards an uptrend, the wave should be used to identify an entry point in the direction opposite of the direction.
For instance, if the tide is showing an uptrend, you are using the second screen to identify a weakness on a daily chart as your bullish entry position.
When to Sell
The same methodology is applied for short positions as well. If the first screen – the tide – is pointing towards a downtrend, you can only sell. In this case, you are looking for a temporary uptrend with an idea of selling the asset. Therefore, you should ignore all buy signals, and focus on generating a sell signal, as the bullish route has been eliminated by the first screen.
Using the Triple Screen Trading System in MetaTrader 4
This system can easily be set up when using the MetaTrader 4 platform. There are indicator options and advanced functions that make this system possible. Before diving straight into this method, back-test your strategy on a demo account on MetaTrader4 by looking into the past performance.

You can test various indicators that appeal to your own trades and style. Although there was immense trepidation surrounding falling volumes, the impact has been negligible. Make sure that you familiarize yourself with this trading technique before you start trading live markets and risk your own capital.
PEOPLE WHO READ THIS ALSO VIEWED:


