The MACD divergence strategy is a great way of analysing the market and confirming a trend reversal, and if used correctly it can also be utilised to define specific entry points into the market.
YOUR CAPITAL IS AT RISK

In this article, we will show you how by going through:
Table of contents
What Is The MACD (Moving Average Convergence Divergence)?
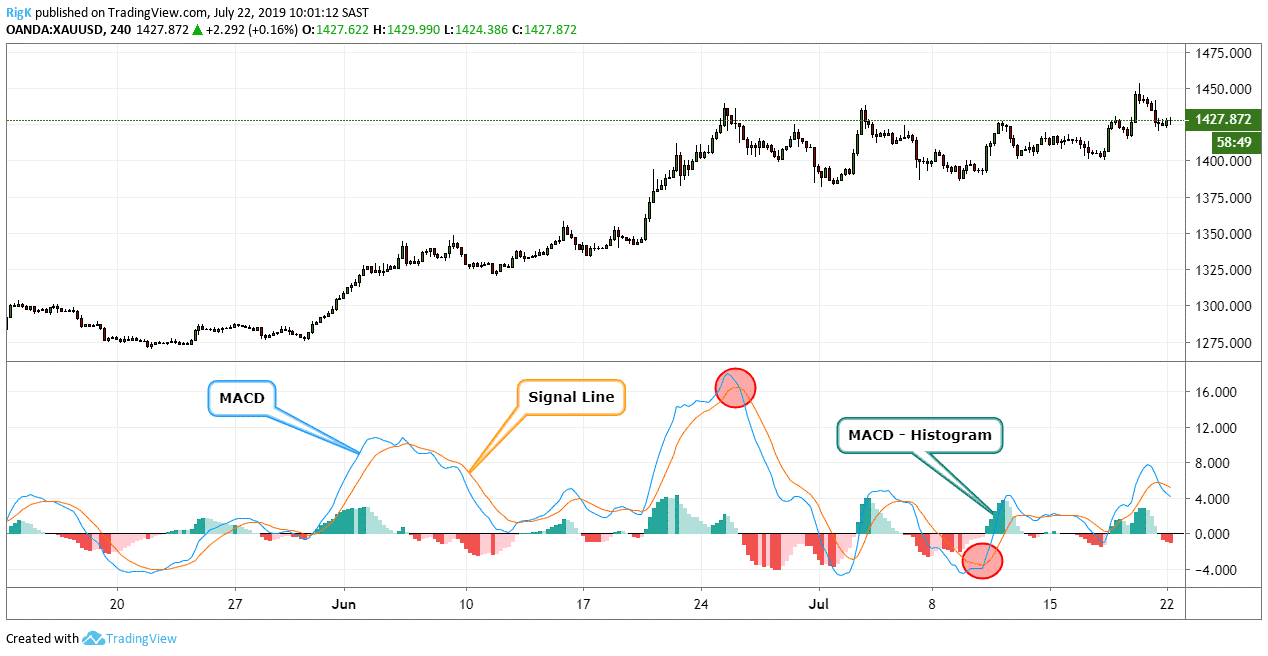
The MACD or Moving Average Convergence Divergence is a momentum indicator showing the relationship between two moving averages of an asset's price. The indicator is calculated by subtracting a 26-period Exponential Moving Average from the 12-period moving average. There is also a histogram available on the indicator which can also be used as a divergence indicator.
As a result, you will then see the MACD line, which shows as an indicator below the price chart. On the indicator, you will also see a 9-period EMA of the MACD, which is also referred to as the ‘signal line’.
The signal line can be used to pinpoint entries into the market. For example, buying when the signal line crosses above the MACD line and selling when it crosses below.
What is MACD Divergence?
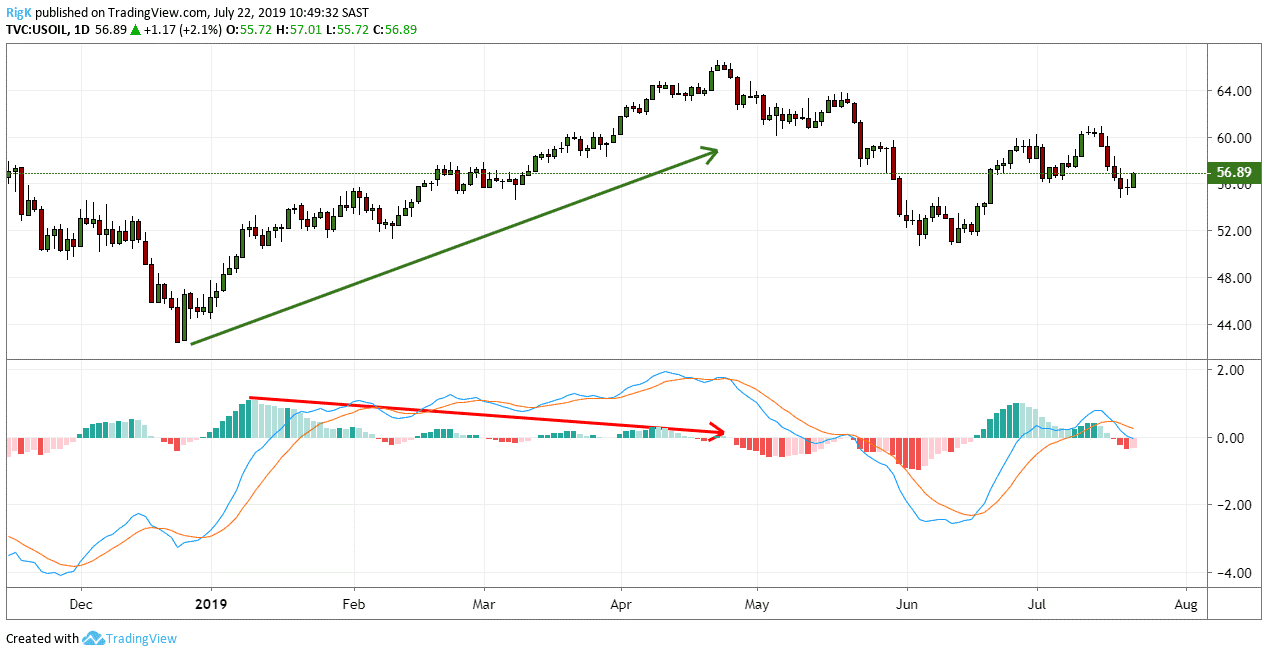
Divergence as a general term in trading can be defined as when an oscillator or momentum indicator does not confirm the direction of the current price movement.
MACD divergence is the same. It is when the price moves in one direction and the MACD moves in the opposite direction.
For example, if the price of the EURUSD makes higher highs, but the MACD shows lower highs, this is considered divergence, or MACD divergence.
YOUR CAPITAL IS AT RISK
How to Trade Using MACD Divergence
There are two moving averages available that come at different speeds: one that responds to price change quicker, and the other slower.
When a new trend occurs, the fast line will react first and eventually cross the slower line.
When this “crossover” occurs, and the fast line starts to “diverge” or move away from the slower line, it often indicates that a new trend has formed.
For example, when the downtrend begins, and the fast line diverges away from the slow line, the histogram gets more prominent, which indicates a strong trend. However, moving averages are known to tend to lag behind price.
MACD Trading Strategy
When you trade this MACD strategy the aim is to find the end of corrections within a trend. You might have heard the term: “The trend is your friend” before? Well, if you have a way to find the end of corrections within a trend, then the path of least resistance would be to trade with the trend and not against it when a correction comes to an end.
That is exactly what this strategy tries to achieve but to do that it uses a combination of multi-timeframe analysis, trend identification, and MACD divergence.
Useful Pages:
Compare Stock Brokers | Compare Forex Brokers | Compare CFD Brokers
STEP 1: TREND IDENTIFICATION
Since we want to be trading with the trend, we need to determine the direction of the trend first, and when it might be coming to an end.
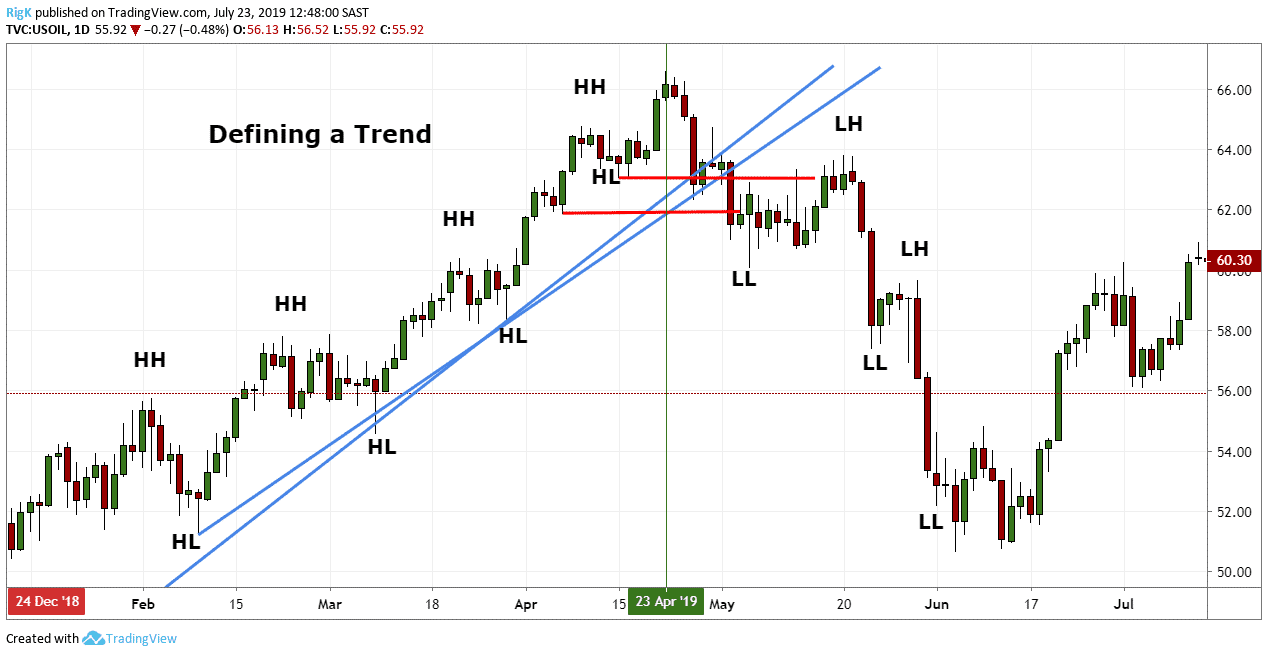
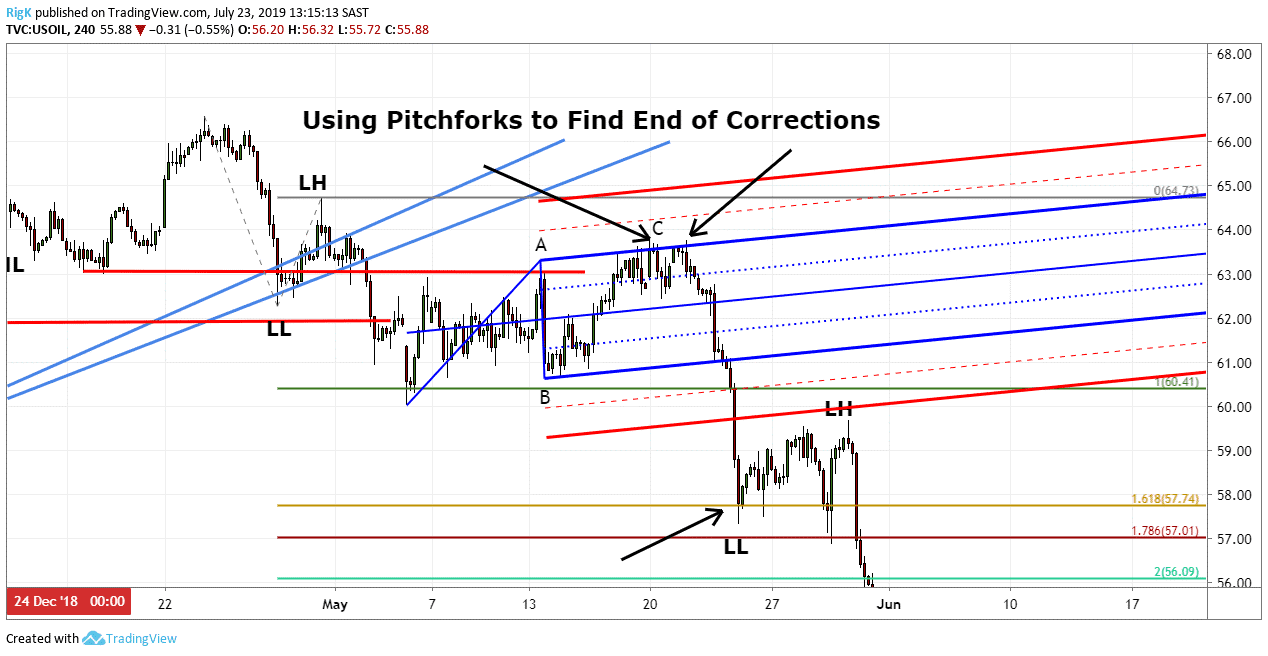
The chart above is that of Crude Oil on a 4-hour timeframe and you can see very basic trend lines (in blue) to show the direction of the trend. Price was also making higher highs (HH) and higher lows (HL) which is typical of an upward trending market.
After the high that formed on the 23rd April 2019, the price started moving lower, breaking the trend lines and previous market structure (red horizontal lines). This occurrence warned of a possible change in trend.
STEP 2: CORRECTIONS AND MARKET GEOMETRY
The next step is to anticipate where corrections might appear.
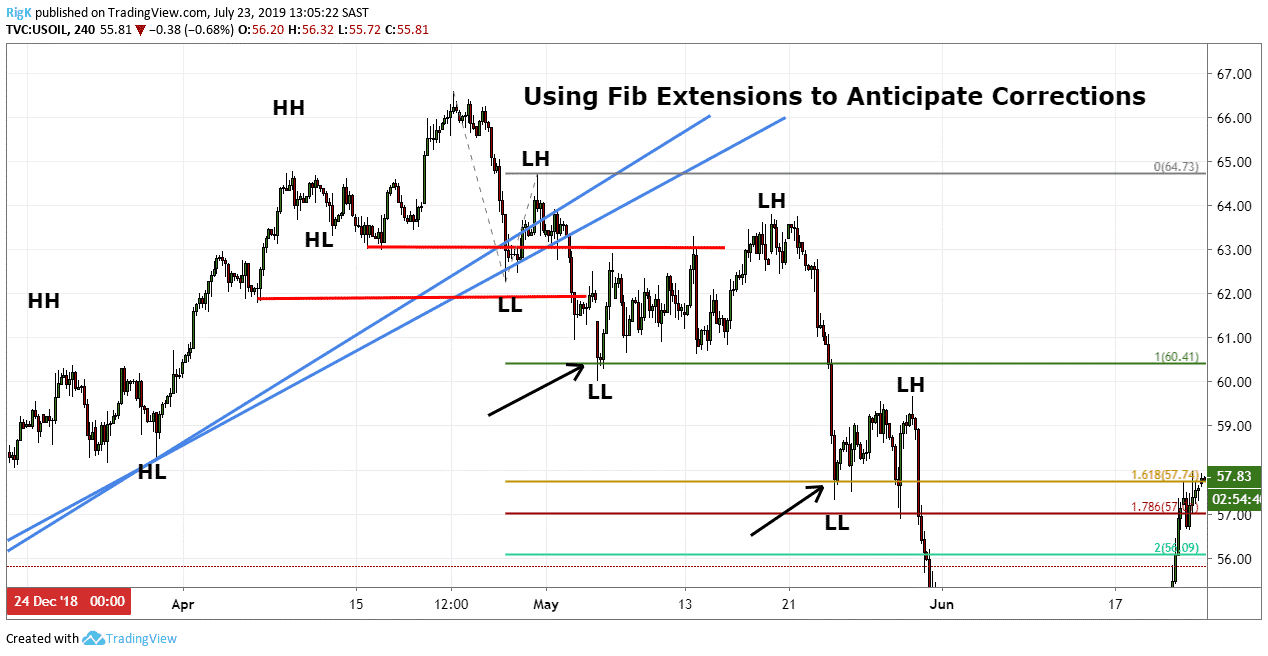
After price created the first lower low (LL) and lower high (LH), I used the Fib Extension tool to project levels, to the downside, where we could expect support to come in, followed by a possible correction.
Look at what happened when the price reached the 100% and 1.618% Fib Extension levels. Support came in, and on both occasions, the price started correcting higher.
YOUR CAPITAL IS AT RISK
Once there was confirmation that a correction was underway, it was time to use the Schiff pitchfork. Since corrections typically move in zig-zag patterns, they are labelled as A-B-C or different variations of that.
Rather than worrying about the exact swings to use when labelling corrections, the pitchfork acts as a guide, so that you can identify an area where a correction may end.
In this case, the correction ran out of steam and ended at the upper median line of the Schiff pitchfork.
STEP 3: USING THE MACD-HISTOGRAM FOR TRADE CONFIRMATION
Step 3 is the most crucial part of the entire trade process since.
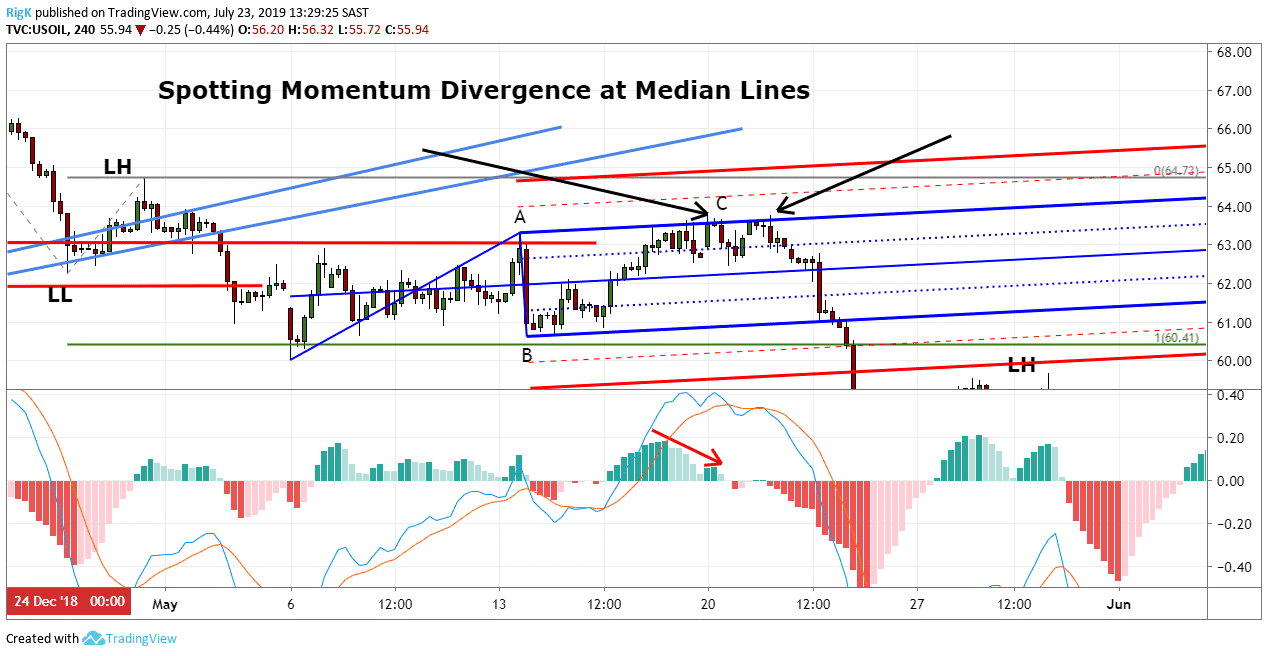
Look at what happened when the price started approaching the upper median line.
The MACD-Histogram started diverting from what price was doing, resulting in momentum divergence. The momentum divergence on the MACD-Histogram, therefore, signalled a short position entry in Crude Oil.
For a bullish signal, you would need to look for the opposite.
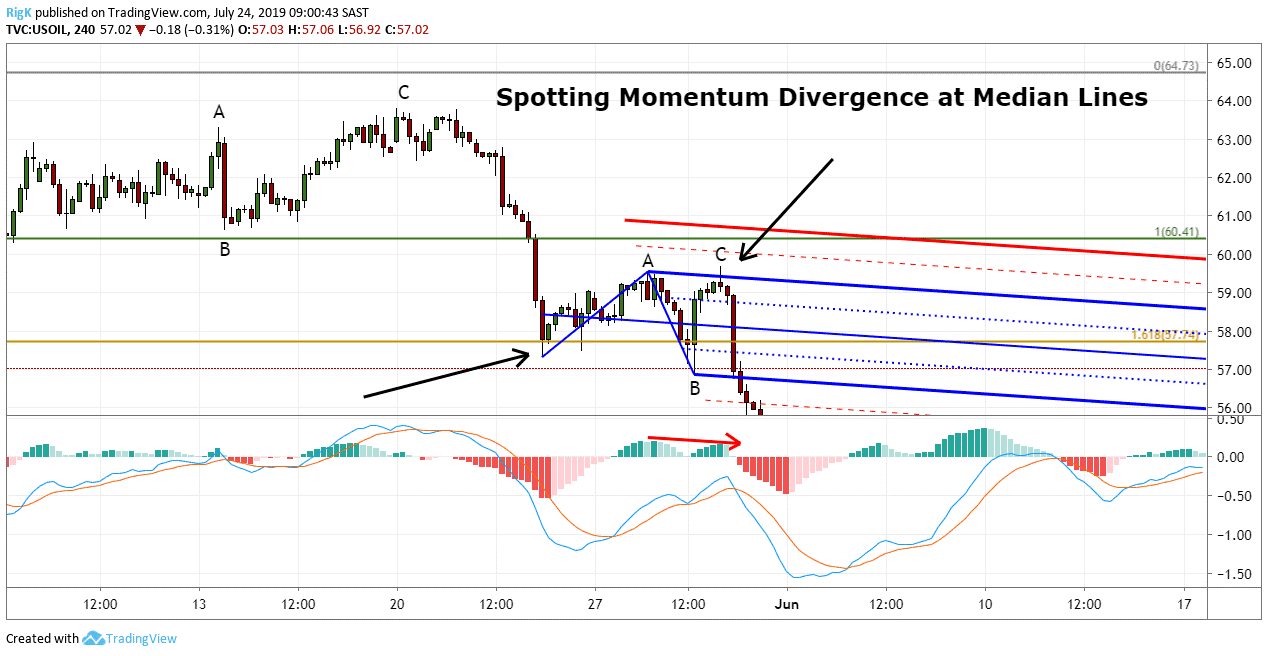
Tip: Using a lower timeframe, like the 30-minute is a great way to confirm momentum divergence if you are unsure about what your larger timeframe might be indicating.
STEP 4: TRADE ENTRY AND MANAGEMENT
YOUR CAPITAL IS AT RISK
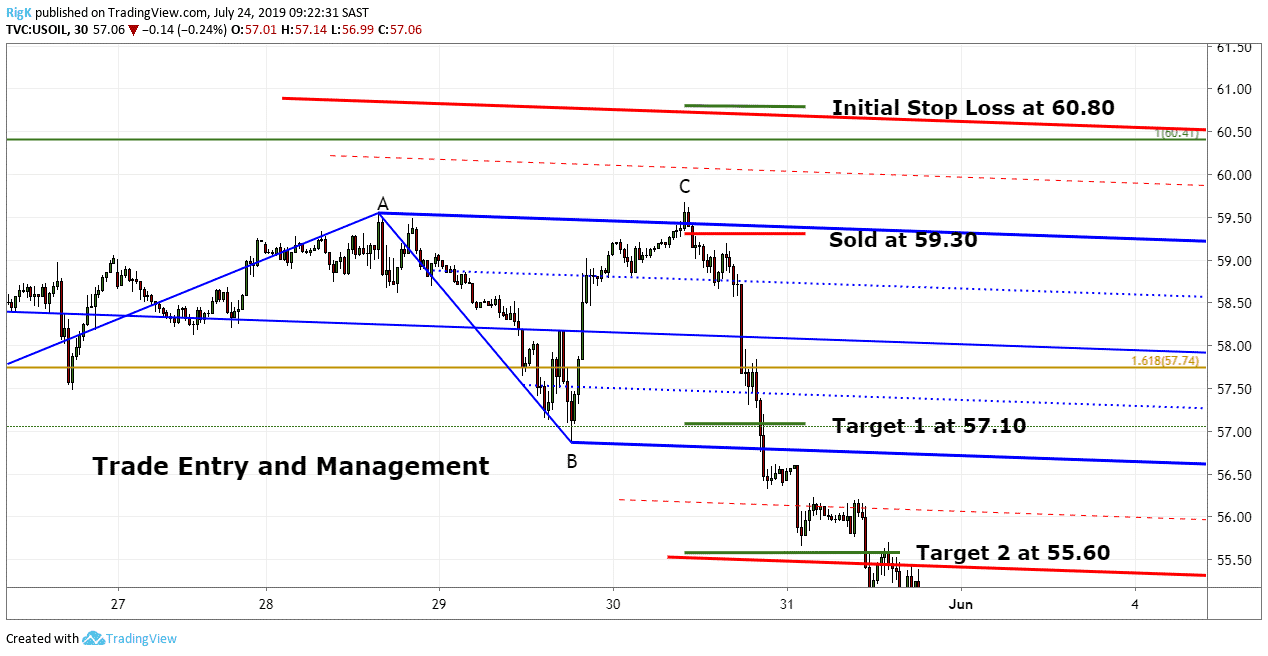
Once the MACD confirmed that the conditions were ripe to enter, the sell order was placed at 59.30 with a stop-loss order above the red warning line at 60.80.
There are typically two targets and in this case, the first target was placed at the low of the correction with the second target at the lower red warning line.
Tip: Not only do pitchforks work great at finding the end of corrections, but they ALSO work well to determine where you should place your targets.
Just make sure that your pitchfork is sloping into the direction you want to trade.
Which Indicator Works Best With MACD?
MACD works with the following indicators:
20-period Simple Moving Average
SMA calculates the average of a selected range of prices, usually closing prices, by the number of periods in that range
Relative Vigor Index (RVI)
The RVI is an oscillator that focuses on a security’s closing price to its price range.
Money Flow Index (MFI)
This oscillator focuses on both price and volume. It will generate less buy and sell signals compared to other oscillators because the MFI requires both price movement and surges in volume to produce extreme readings.
Triple Exponential Moving Average (TEMA)
TEMA is an indicator that smooths out three exponential moving averages.
TRIX
The TRIX is a nice pairing with the MACD because it is an oscillator, but more importantly, it is a momentum oscillator.
Awesome Oscillator (AO)
Awesome Oscillator is the difference of a 5-period simple moving average and a 34-period simple moving average.
How Accurate is MACD Divergence?
Just like any other trading indicator, it is best not to use MACD in isolation. Instead, to use it with other indicators.
This is because MACD divergence when on its own, doesn't signal a reversal in price with the precision required for day trading. Besides, MACD is no longer useful after a strong price rally.
Thus, traders should focus more on price action and trends instead of MACD divergence.
YOUR CAPITAL IS AT RISK
MACD Divergence Advantages & Disadvantages
The MACD divergence strategy has some fantastic advantages, but it also comes with disadvantages. Some of the pros and cons of the strategy are:
MACD Divergence Advantages:
- Defines exact entry and exit points
- Filters out losing trades via confluence with the pitchfork indicator
- Can be used on any asset
MACD Divergence Disadvantages:
- Momentum indicators are unable to confirm trend reversals without other technical analysis indicators
- A lot of time needed to analyse the markets
The Bottom Line
Technical analysis indicators are great tools that can assist you in making trading decisions, but when used on their own, with no solid trading strategy as a backup they can lead to disaster.
Following a process, before you trade, like the strategy shown, helps to prepare you for an entry ahead of time.
A great indicator like the MACD, when used in conjunction with other analytical techniques can help to greatly improve your accuracy, and provide you with a tried and tested trading method.
Further Reading:
- Find Out the Best Technical Trading Indicators for New Traders
- Here Are Our Complete Guide and Tutorial to Find Out Your RSI Trading Strategies
- Explore Here the Forex Brokers to Trade With and Test Your Strategies
